- Research
- Open access
- Published:
A machine learning-based credit risk prediction engine system using a stacked classifier and a filter-based feature selection method
Journal of Big Data volume 11, Article number: 23 (2024)
Abstract
Credit risk prediction is a crucial task for financial institutions. The technological advancements in machine learning, coupled with the availability of data and computing power, has given rise to more credit risk prediction models in financial institutions. In this paper, we propose a stacked classifier approach coupled with a filter-based feature selection (FS) technique to achieve efficient credit risk prediction using multiple datasets. The proposed stacked model includes the following base estimators: Random Forest (RF), Gradient Boosting (GB), and Extreme Gradient Boosting (XGB). Furthermore, the estimators in the Stacked architecture were linked sequentially to extract the best performance. The filter- based FS method that is used in this research is based on information gain (IG) theory. The proposed algorithm was evaluated using the accuracy, the F1-Score and the Area Under the Curve (AUC). Furthermore, the Stacked algorithm was compared to the following methods: Artificial Neural Network (ANN), Decision Tree (DT), and k-Nearest Neighbour (KNN). The experimental results show that stacked model obtained AUCs of 0.934, 0.944 and 0.870 on the Australian, German and Taiwan datasets, respectively. These results, in conjunction with the accuracy and F1-score metrics, demonstrated that the proposed stacked classifier outperforms the individual estimators and other existing methods.
Introduction
One of the earliest applications of machine learning was for the prediction of credit risk, which uses financial data to predict the risk of customers defaulting a loan, credit card, and other lending services [1]. Credit risk prediction is a challenge for financial institutions, and several research works have attempted to address this problem [2]. The proper utilization of credit risk prediction tools can lead to increased profitability for financial institutions. Credit card and loan applications are two areas where this can be applied. Creditors who have been unable to adequately predict the credit risk of potential clients have had severe losses. Hence, proper risk assessment is crucial for the survival of these financial institutions [3].
Credit risk prediction has been a trending topic for the past few decades; credit card default prediction is among the most crucial tasks facing creditors. This is because the numbers of default transactions considerably outnumber the non-default transactions [4]. Therefore, the datasets used for credit risk prediction can be considered to have a class imbalance problem. Prior studies have shown that class imbalance can lead to poor classification performance of machine learning (ML) models that results in model bias towards a specific class at inference time [5]. In literature, several techniques have been proposed to solve the class imbalance problem, and they can be classified into three groups: ensemble learning, cost-sensitive learning, and re-sampling methods. Among these three methods, ensemble learning has been widely studied [6]. Ensemble learners perform better than a single model since they combine the advantages of several base learners. Furthermore, ensemble models can be divided into two groups: classifier ensemble and hybrid classifier. The former implies an ensemble model that combines an attribute selection technique or hyperparameter tuning prior to the classification whereas the latter combines numerous classifiers that run side by side [7].
Moreover, the datasets that are used to build credit risk prediction systems may possess a large feature space [16]. This can lead to an increased complexity while training machine learning models [37]. It is therefore vital to implement a feature selection (FS) algorithm that can alleviate the growing issue of feature space. FS algorithms are categorized as follows: filter, wrapper and hybrid. The filter-based FS make its decision based on the intrinsic nature of the dataset and therefore, is independent from the estimator that is used. The wrapper-based FS selects an optimal subset of features based on the performance obtained using estimator. Finally, the hybrid-based FS algorithms combines the filer and wrapper-based methodologies [8, 9].
In this research we implement a filter-based FS method that uses Information Gain (IG) [28]. IG is inspired from Information Theory [29]. The filter-based FS technique is selected because it is computationally less expensive in comparison to the wrapper and hybrid-based approaches [10].
Furthermore, we develop a multilevel ensemble-based model using the stacking method. Stacking or Stacked generalization is a technique that stacks the output of individual algorithms and uses a single classifier for the final prediction. This method uses the effectiveness of each individual classifier within a stack and utilizes their results as the input the final estimator [17]. The structure of the stack includes the following algorithms: Gradient Boosting [18], Random Forest [21] and Extreme Gradient Boosting [19].
The major contributions of this research are as follows:
-
An IG filter-based FS method is implemented on multiple credit-risk datasets. This algorithm will ensure that only the best attributes are selected before the modelling process.
-
We implement a Stacked-based model using XGB, RF, and XGB. To achieve the best performance, the Stacked model was built sequentially. Further- more, we compare the performance of the Stacked-model against individual estimators.
The remaining part of this paper is structured as follows. "Related work" section presents a review of related works. In "Machine learning methods" section, we provide a background of the various machine learning algorithms used in this research. "Datasets" section provides an overview of the datasets. "Research Methodology" section presents the methodology that was followed in this research. "Feature Selection" section provides the details about the experimental settings. "Proposed Credit Risk Prediction Framework" section discusses the results and "Experimental Setup and Performance metrics" section concludes this paper.
Related work
Pande et al. [11] conducted a credit risk analysis using machine learning classifiers. In this analysis, the authors considered several methods including Artificial Neural Network (ANN), k-Nearest Neighbour and Naive Bayes (NB). To evaluate the performance of the ML models, the authors used the German credit risk dataset and the accuracy was considered as the main performance metric. The results demonstrated that the ANN, NB and KNN obtained accuracies of 77.45%, 77.20%, and 72.20%, respectively. Although these results represent a step in the right direction; the authors did not evaluate their models using additional metrics such as the F1-Score and Area Under the Curve (AUC) score.
Zhang et al. in [12] presented a credit scoring algorithm using adaptive sup- port vector machine (AdaSVM). This method was assessed on the Australian credit risk dataset and evaluated using the accuracy. The results demonstrated that the AdaSVM obtained an accuracy of 80%. This paper did not expand further in terms of evaluating the quality of classification by using additional metrics such the precision and recall.
Nasser and Maryam [13] developed a customer credit risk assessment system using Artificial Neural Networks (ANNs). In this research, the authors considered learning method such as the Gradient Descent. Moreover, the accuracy was the main performance metric that was utilized to assess the effectiveness of the proposed method. Furthermore, the authors used the Australian, Japanese and German credit risk datasets. The outcome of the experiments demonstrated that the ANN-GD obtained accuracies of 78.11%, 76.87%, and 68.26% for each dataset, respectively.
Hsu et al. [14] implemented an enhanced recurrent neural network (RNN) for combining static and dynamic attributes for credit card default prediction. This method was developed using an enhanced RNN and was evaluated using the Taiwan credit risk dataset. To enhance the RNN, the authors Gated Recurrent Units (GRUs) as the base nodes. The outcome of the numerical experiments showed that the RNN model achieved an AUC of 0.782 and a lift index of 0.659.
In [15], the authors presented a combination strategy of integrating super- vised learning coupled with unsupervised learning for credit risk assessment. In this work, the researchers used datasets such as the German dataset to assess the effectiveness of their proposed algorithms. Additionally, metrics such as the accuracy and the AUC were used to assess the performance of methods. In the instance of cluster-based approach, the KNN achieved an accuracy of 76.80 % and an AUC of 0.788. The RF achieved an accuracy of 72.10 % and an AUC of 0.811. The ANN obtained an accuracy of 78.6% and an AUC of 0.843. Finally, the cluster-based consensus (combined model) obtained an accuracy 80.8%.
Ha et al. [16] implemented an improved credit risk prediction model for online peer-to-peer (P2P) lending systems using a feature selection (FS) method and deep learning (DL). In this study, the first step consisted of preprocessing the data. The second step involved feature selection using Restricted Boltzmann Machines (RBMs). In the third step, the authors implemented the modeling process using machine learning (ML) methods such as Linear Discriminant Analysis (LDA), Artificial Neural Networks (ANN), k-Nearest Neighbors (KNN), and Random Forest (RF). These models were evaluated on various datasets, including the Australian and German credit risk datasets. Accuracy was the primary performance metric considered in the experiments. For the German dataset, the results showed the following accuracies: 76.50%, 75.8%, 67.10%, and 67.72% for LDA, ANN, KNN, and RF, respectively. For the Australian dataset, LDA, ANN, KNN, and RF achieved the following accuracies: 85.80%, 71.45%, 65.94%, and 67.72%, respectively. Although these results demonstrated some improvements compared to existing methods, the authors did not consider additional metrics such as precision, recall, and AUC.
Machine learning methods
This section provides an overview of the machine learning methods that were considered in this paper.
The RF algorithm computes its predictions by using a group of n Decision Trees (DTs) [20]. DT is a supervised ML technique that is used for classification and regression problems. A DT has the following categories of nodes: leaf node, decision node, and root node. The decision node represents a splitting point in a DT. A leaf node computes the final decision of the DT. The root node represents the initial state in the DT approach. Majority vote is a process that the RF algorithm uses to compute the predictions [21] as follows: let RF = {f (X, di)}, where i is the number of DTs and X represents an input vector and di is a set of DTs. The majority vote process is computed by di. The class with the most votes represents the prediction.
K-Nearest Neighbor (KNN) technique is a supervised ML method used for classification and regression tasks. The KNN approach uses the standard Euclidean (ED) method to compute the distance between data points as follows [22]: let n and m data points in space Q, the distance between n and m, D(n, m), is computed using the expression in (3).
where t is total number of data points in space Q. The KNN approach estimates a prediction n0 in Q by computing the ED between n0 and its k closest data points within Q. As a result, n0 is assumed to be like its neighbors [23].
Artificial Neural Network (ANN) is another type of ML algorithm that is used for classification and regression tasks. In this research, we used feed for- ward ANNs. ANNs are built using Artificial Neurons (ANs). An AN processes information from its input and forwards it to its output. Moreover, an AN is designed to solve both linear and non-linear problems. This is achieved by using different types of activation functions such as the Sigmoid, \(\sigma = \frac{1}{1+{e}^{-2}}\); the Rectified Linear Unit (ReLU): f (x) = max(0, x); or an hyperbolic tangent in (2).
Gradient boosting (GB) is a technique used to build regression and classification models to improve the learning process of the final model. In the GB algorithm, a meta-learner is built by using a group of weak estimators such as DTs. Each estimator is gradually added to the base group in a sequential manner. The aim of this process is to optimize the performance of the ensemble model by rectifying the mistakes made by the previous meta-learner [18]. This can be mathematically expressed as follows:
where g represents the ensemble, t is the total number of estimators, hn represents a single learner, and θn is a tunable parameter.
In this research, we selected feed forward ANNs because of their simplicity and training efficiency. ANNs are generally simpler in their structure compared to GANs. This simplicity is evident in their operational mechanics, as FFNNs involve a straightforward processing of inputs through hidden layers to outputs, using weights and biases, followed by an activation function. This linear processing makes FFNNs inherently less complex and more efficient in training than GANs, which require training two networks simultaneously (generator and discriminator). This complexity in GANs can lead to longer training times and increased computational cost [38].
Furthermore, we have selected ANNs because of the low computational cost and high scalability. From a computational standpoint, ANNs are generally more cost-effective. They require less computational power due to their simpler architecture, which also makes them more scalable for handling large datasets typical in credit risk analysis. In contrast, the dual-network structure of GANs demands more computational resources, leading to higher costs, especially when scaling up for extensive datasets. [39]. Additionally, we used ANNs because of model stability and predictive accuracy as explained in [40].
Finally, it must be noted that Generative Adversarial Networks (GANs) [36] or a Transformers based architecture could be considered in lieu of ANNs. However, GANs or Transformers are computationally expensive to train and require long training times. Moreover, GANs are better suited for tasks that involve data generation or more complex scenarios where adversarial training is beneficial.
Datasets
All the datasets used in this work were obtained from the University of California, Irvine (UCI) machine learning repository. The Australian credit approval dataset [25] contains 690 instances and 14 attributes; in this dataset, there are 307 creditworthy clients and 383 defaulting clients. The German credit dataset [26] comprises 1000 cases and 20 features, with 700 creditworthy clients and 300 defaulting clients. Meanwhile, the Taiwan default of credit clients dataset [27] contains 30000 instances and 24 attributes, with 23364 creditworthy clients and 6636 defaulting clients. The German and Taiwan datasets are highly imbalanced, whereas the Australian credit dataset is relatively balanced. A summary of the number of features and instances in these datasets is provided in Table 1. The details about the nature of features in each dataset are provided in Tables 2, 3, 4. Moreover, these datasets are mostly made up of financial records and personal information, which were encoded for confidentiality reasons.
Research methodology
Feature selection
In this research, a feature selection method is applied to pick the most optimal attributes that will be used in the classification process. The IG-FS in Fig. 1 ranks the attributes using an method based on Information Gain (IG) [28] which is derived from Information Theory [29]. IG-FS computes the IG of each attribute with relation to the class attribute. In contrast with the standard correlation methods such as the Pearson Linear Correlation Coefficient [30] that is only able of establishing linear relationship between attributes, IG can uncover nonlinear relationships as well. The IG is mathematically computed as follows:

The Proposed credit risk prediction framework
Therefore, a feature A is strongly correlated to feature B than to feature V if IG(A | B) > G(V | B). Algorithm 1 shows the implementation of the IG ranking algorithm that was used to reduce the number of features in each of the datasets that were used. In the ranking algorithm, X is the original set of features, Xranked represents the subset of features that is selected using the IG method. The selected attributes are loaded in Xranked using a threshold value, IGtresh. This value can be changed as required. C is the target feature (the class).
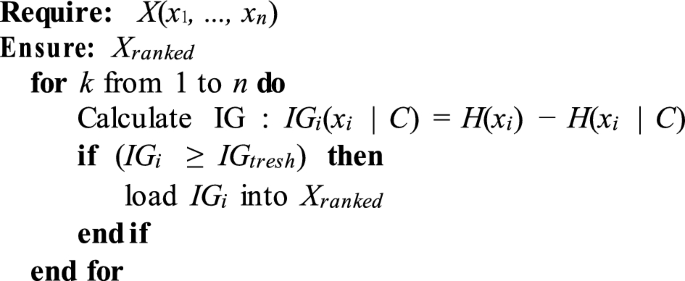
IG-FS Ranking Algorithm
Proposed credit risk prediction framework
The proposed credit risk prediction framework is depicted in Fig. 1. This architecture includes two main phases, namely, the data processing phase (phase 1) and the modelling phase (phase 2). In the first phase, the full credit card fraud dataset is normalized and processed using the IG-based FS method. Moreover, the full dataset is split into a training data subset and testing data subset. In the modelling phase, the following individual classifiers are considered: RF, KNN, ANN, GB, and XGB. The proposed stacked classifier is built using the GB, XGB and RF estimators. Furthermore, once phase 1 is completed; each of the estimators in phase 2 are trained and tested using the training and testing sets generated from phase 1. The evaluation process is conducted using the accuracy, the f1-score and the Area Under the ROC Curve (AUC) as explained in "Feature Selection" section. The Compare Results block compares the metrics generated by each classifier and forwards the results to the Select Best Classifier for model selection.
Experimental setup and performance metrics
The experiments were implemented on Google Colab [31]. The compute specifications are as follows: Intel(R) Xeon(R), 2.30GHz, 2 Cores. The ML framework used in this research is the Scikit-Learn [32].
Performance metrics are important factors to consider when evaluating the performance of classifiers. In this work, the following performance metrics are considered: accuracy, F1-score, and Area Under the ROC Curve [33,34,35]. These metrics are computed using the true positive (TP), true negative (TN), false positive (FP), and false negative (FN):
-
TP: Instances (data points) correctly predicted as positive.
-
TN: Instances correctly predicted as negative.
-
FP: Instances incorrectly predicted as positive (also known as Type I error).
-
FN: Instances incorrectly predicted as negative (also known as Type II error).
The Accuracy is the ratio of correctly predicted instances; it is, however, not an effective metric in evaluating classifier performance when the data is imbalanced since it is sensitive to the distribution of the data. The F1-score is a more effective performance metric that represents the harmonic mean of the precision and sensitivity (recall) of the classifier. AUC demonstrates the tradeoff between the true positive rate (TPR) and false-positive rate (FPR), and it is an indication of the model’s ability to classify positive samples correctly. The mathematical representations of the performance metrics are shown below:
Results and discussions
This section discusses the results that were obtained after conducting the experiments in a simulated environment.
Table 5 shows the number of features that were selected using IG-FS. In the instance of the Australian dataset, 9 features were selected. For the German dataset, 13 features were selected. In the case of the Taiwan dataset, 17 attributes were picked. These selected features are used for the experiments presented in this proposed study.
Table 6 shows the results that were obtained using the Australian dataset and the Stacked model had the structure and hyperparameters shown in Fig. 2.

Structure and hyperparameters of the Stacked model in Table 6
In this instance the model that achieved the highest accuracy is the RF model with an accuracy of 87.68%. The model that underperformed in comparison to other estimators is the KNN method with an accuracy of 70.28%, a F1-Score of 60.19%, and an AUC of 0.683. In contrast, the Stacked model achieved the best and most optimal results with an accuracy of 86.23%, an F1-Score of 84.58%, and an AUC of 0.934. These results demonstrated that using a Stacked approach substantially improves the F1-Score and the AUC.
Table 7 outlines the results that were achieved using the German dataset and the structure and hyperparameters of the Stacked model in Table 7 are showing in Fig. 3. The model that performed the best is the Stacked algorithm with an accuracy of 82.80%, a F1-Score of 86.35 %, and an AUC of 0.944. Moreover, the Stacked model outperformed all other methodologies in terms of overall performance. In contrast, the model that underperformed is the KNN method with an accuracy of 68.40%, a F1-Score of 48.82%, and an AUC of 0.547. In terms of accuracy, the other models that performed optimally are the RF, GB, XGB, ANN, and DT with the following scores, respectively: 75.20%, 72.40%, 74.80%, and 73.60%. Table 5 shows the results that were obtained using the Taiwan dataset a.

Structure and hyperparameters of the Stacked model in Table 7
In terms of accuracy, the method that performed optimally is the RF with an accuracy 87%. In terms of overall performance, the Stacked algorithm achieved an accuracy of 86.23%, a F1-Score of 84.58% and a AUC of 0.934 %. The experiments on the Taiwan dataset demonstrated the same pattern that has been observed on the Australian and German datasets. Using the Stacked-based methodology has proven to produce results that are superior to individual estimators.
In comparison to the research that were proposed in [11] using the German dataset, the proposed Stacked model outperformed the ANN, NB, and KNN by the following accuracy margins, respectively: 5.35%, 5.6%, and 10.6%. The research in [12] considered the AdaSVM and achieved an accuracy of 80% on the Australian dataset. In contrast, our proposed Stacked model obtained an accuracy that is 6.23% higher than the AdaSVM. The research in [13] used ANNs-GD on the Australian and German datasets and obtained accuracies of 78.11% and 68.26%. In comparison to the ANNs-GD, the Stacked model obtained the following superior results using the same datasets: 86.23% and 82.80%. Furthermore, the researchers in [14] used RNNs and obtained AUC 0.782 using the Taiwan dataset. In contrast, the Stacked model obtained an AUC of 0.870 on the same dataset. This represents an increase of 0.088. Additionally, the researcher in [16] used the KNN, RF, and ANN using credit risk datasets such as the German dataset and obtained an accuracy of 76.80%, 72.10%, and 78.6%, respectively. In terms of AUC, the KNN, RF, and ANN achieved 0.788, 0.811, and 0.843, respectively. In contrast, the Stacked method obtained much higher performance results as shown in Table 8. The structure and the hyperparameters of the Stacked model are depicted in Fig. 4.

Structure and hyperparameters of the Stacked model in Table 8
Conclusion
This research presented the development and implementation of a ML-based credit risk prediction model. This method was implemented using a FS method based on IG in conjunction with a stacking algorithm. These processes were implemented on the Australian, German, and Taiwan datasets. The accuracy, the F1-Score, and AUC were the performance metrics the were used to evaluate the performance of the proposed method. To put the experimental process into context, the following additional ML methods were considered: RF, GB, XGB, KNN, ANN, and DT. The outcome of the numerical experiments demonstrated that the proposed Stacked algorithm achieved an accuracy of 86.23%, a F1- Score of 84.58% and AUC of 0.934 in the instance of the Australian dataset. With regards to the German dataset, the Stacked method obtained an accuracy of 82.80%, a F1-Score of 86.35% and AUC of 0.944. Finally, for the Taiwan dataset, the Stacked method achieved an accuracy of 85.80%, a F1-Score of 51.35 % and AUC of 0.870. These results were superior to those obtained by individual estimators and other existing algorithms. In future work, our aim is to delve deeper into the realm of feature selection and augmentation techniques with the objective of improving the performance of the proposed machine learning model. We envisage a comprehensive investigation into the applicability and efficacy of transformer-based architectures, which have recently gained prominence in various domains such as text generation and classification, to address the intricate challenges associated with credit risk prediction.
Availability of data and materials
Available upon request.
References
Moradi S, Mokhatab RF. A dynamic credit risk assess- ment model with data mining techniques: evidence from Iranian banks. Financ Innov. 2019;5(1):15.
Rehman ZU, Muhammad N, Sarwar B, Raz MA. Impact of risk management strategies on the credit risk faced by commercial banks of Balochistan. Financ Innov. 2019;5(1):44.
Khemakhem S, Boujelbene Y. Predicting credit risk on the basis of financial and non-financial variables and data mining. Rev Acc Financ. 2018;17(3):316–40.
Dornadula VN, Geetha S. Credit card fraud detection using machine learning algorithms. Procedia Computer Science. 2019;165:631–41.
Garcıa V, Marques AI, S´anchez J.S. Improving Risk Pre- dictions by Preprocessing Imbalanced Credit Data. Neural Information Processing. 2012;67:68–75.
Song Y, Peng Y. A MCDM-Based Evaluation Approach for Imbalanced Classification Methods in Financial Risk Prediction. IEEE Access. 2019;7:84897–906.
Guo S, He H, Huang X. A multi-stage self-adaptive classi- fier ensemble model with application in credit scoring. IEEE Access. 2019;7:78549–59.
Liu H, Yu L. Toward integrating feature selection algorithms for classification and clustering. IEEE Tran Knowl Data Eng. 2005;17(4):491–502.
Tang PS, Tang XL, Tao ZY, Li JP (2014) Research on feature selection algorithm based on mutual information and genetic algorithm. 11th Int. Comput. Conf. Wavelet Active Media Tech. Inf. Processing (ICCWAMTIP) IEEE, 403–406.
Liu C, Wang Q, Zhao Q, Shen X, Konan M. A new feature selection method based on a validity index of feature subset. Pattern Recogn Lett. 2017;92:1–8.
Pandey TN, Jagadev AK, Mohapatra SK, Dehuri S (2017) Credit risk analysis using machine learning classifiers. In: 2017 International Conference on Energy, Communication, Data Analytics and Soft Computing (ICECDS) (pp. 1850–1854). IEEE.
Zhang L, Hui X, Wang L (2009) Application of adaptive support vector machines method in credit scoring. In: International Conference on Management Science and Engineering, 1410–1415.
Mohammadi N, Zangeneh M. Customer credit risk assess- ment using artificial neural networks. IJ Information Technol Computer Science. 2016;8(3):58–66.
Hsu TC, Liou ST, Wang YP, Huang YS, Che-Lin (2019) Enhanced Recurrent Neural Network for Combining Static and Dynamic Features for Credit Card Default Prediction. In: IEEE International Conference on Acoustics, Speech and Signal Processing (ICASSP), 1572–1576.
Bao W, Lianju N, Yue K. Integration of unsupervised and supervised machine learning algorithms for credit risk assessment. Expert Syst Appl. 2019;128:301–15.
Ha VS, Lu DN, Choi GS, Nguyen HN, Yoon B (2019) Improv- ing credit risk prediction in online peer-to-peer (P2P) lending using feature selection with deep learning. In: 21st International Conference on Advanced Communication Technology, 511–515.
Chen C, Zhang Q, Yu B, Yu Z, Lawrence PJ, Ma Q, Zhang Y. Improving protein-protein interactions prediction accuracy using XGBoost feature selection and stacked ensemble classifier. Comput Biol Med. 2020;123: 103899.
Chakrabarty N, Kundu T, Dandapat S, Sarkar A, Kole DK (2019) Flight arrival delay prediction using gradient boosting classifier. In: Emerging technologies in data mining and information security, 651-659
Weldegebriel HT, Liu H, Haq AU, Bugingo E, Zhang D. A new hybrid convolutional neural network and eXtreme gradient boosting classifier for recognizing handwritten Ethiopian characters. IEEE Access. 2019;8:17804–18.
Liang J, Qin Z, Xiao S, Ou L, Lin X. Efficient & secure decision tree classification for cloud-assisted online diagnosis services. IEEE Trans Dependable Secure Comput. 2019;18(4):1632–44.
Breiman L. Random forests. Mach Learn. 2001;45(1):5–32.
Trstenjak B, Mikac S, Donko D. KNN with TF-IDF based framework for text categorization. Procedia Eng. 2014;69:1356–64.
Tan S. An effective refinement strategy for KNN text classifier. Expert Syst Appl. 2006;3(2):290–8.
Kasongo SM, Sun Y. A deep learning method with filter based feature engineering for wireless intrusion detection system. IEEE access. 2019;7:38597–607.
“UCI Machine Learning Repository: Stat-log (Australian Credit Approval) DataSet.” http://archive.ics.uci.edu/ml/datasets/statlog+(australian+credit+approval) (accessed Oct. 31, 2020).
“UCI Machine Learning Repository: Stat-log (German Credit Data) Data Set.” https://archive.ics.uci.edu/ml/datasets/statlog+(german+credit+data) (accessed Oct. 31, 2020).
“UCI Machine Learning Repository: default of credit card clients Data Set.” https://archive.ics.uci.edu/ml/datasets/default+of+credit+card+clients (accessed Mar. 14, 2020).
Gao Z, Xu Y, Meng F, Qi F, Lin Z (2014) Improved information gain-based feature selection for text categorization. Int. Conf. Wireless Commun. Vehicular Technol. Inform Theory and Aerosp. Electron. Sys. (VITAE) IEEE, 1–5.
Shannon CE. A mathematical theory of communication. ACM SIGMOBILE. 2001;5(1):3–55.
Zhou H, Deng Z, Xia Y, Fu M. A new sampling method in particle filter based on pearson correlation coefficient. Neurocomputing. 2016;216:208–15.
Google Colab [Online]. Available: https://colab.research.google.com/
Scikit-learn : machine learning in Python. https://scikit-learn.org/stable/
Ileberi E, Sun Y, Wang Z. A machine learning based credit card fraud detection using the GA algorithm for feature selection. J Big Data. 2022;9:24.
Lipton ZC, Elkan C, Narayanaswamy B (2014) Thresh- olding Classifiers to Maximize F1 Score. arXiv:1402.1892 [cs, stat], May 2014, Accessed: Nov. 01, 2020. http://arxiv.org/abs/1402.1892
Muschelli J. ROC and AUC with a binary predictor: a poten- tially misleading metric. J Classif. 2020;37(3):696–708.
Creswell A, White T, Dumoulin V, Arulkumaran K, Sengupta B, Bharath AA. Generative adversarial networks: An overview. IEEE Signal Process Mag. 2018;35(1):53–65.
Zhao T, Zheng Y, Wu Z. Feature selection-based machine learning modeling for distributed model predictive control of nonlinear processes. Computers Chem Eng. 2023;169:108074.
Edmond C, Girsang AS. Classification performance for credit scoring using neural network. Int J. 2020;2020(8):5.
Laudani A, Lozito GM, Fulginei FR, Salvini A. On training efficiency and computational costs of a feed forward neural network: A review. Comput Intell Neurosci. 2015;2015(2015):83.
Stoffel M, Bamer F, Markert B. (2019). Stability of feed forward artificial neural networks versus nonlinear structural models in high speed deformations: A critical comparison. Arch Mech. 2019;71(2):34
Acknowledgements
This work was supported in part by the South African National Research Foundation under Grants 137951, 141951 and Grant 132797, and in part by the South African National Research Foundation Incentive under Grant 132159.
Funding
University of Johannesburg.
Author information
Authors and Affiliations
Contributions
IE wrote the algorithms and methods related to this research and he interpreted the results. YS and ZW provided guidance in terms of validating the obtained results. All authors read and approved the final manuscript.
Corresponding author
Ethics declarations
Ethics approval and consent to participate
Not applicable.
Consent for publication
Not applicable.
Competing interests
The authors declare that they have no competing interests.
Additional information
Publisher's Note
Springer Nature remains neutral with regard to jurisdictional claims in published maps and institutional affiliations.
Rights and permissions
Open Access This article is licensed under a Creative Commons Attribution 4.0 International License, which permits use, sharing, adaptation, distribution and reproduction in any medium or format, as long as you give appropriate credit to the original author(s) and the source, provide a link to the Creative Commons licence, and indicate if changes were made. The images or other third party material in this article are included in the article's Creative Commons licence, unless indicated otherwise in a credit line to the material. If material is not included in the article's Creative Commons licence and your intended use is not permitted by statutory regulation or exceeds the permitted use, you will need to obtain permission directly from the copyright holder. To view a copy of this licence, visit http://creativecommons.org/licenses/by/4.0/.
About this article

Cite this article
Emmanuel, I., Sun, Y. & Wang, Z. A machine learning-based credit risk prediction engine system using a stacked classifier and a filter-based feature selection method. J Big Data 11, 23 (2024). https://doi.org/10.1186/s40537-024-00882-0
Received:
Accepted:
Published:
DOI: https://doi.org/10.1186/s40537-024-00882-0