- Research
- Open access
- Published:
Detecting Denial of Service attacks using machine learning algorithms
Journal of Big Data volume 9, Article number: 56 (2022)
Abstract
Currently, Distributed Denial of Service Attacks are the most dangerous cyber danger. By inhibiting the server's ability to provide resources to genuine customers, the affected server's resources, such as bandwidth and buffer size, are slowed down. A mathematical model for distributed denial-of-service attacks is proposed in this study. Machine learning algorithms such as Logistic Regression and Naive Bayes, are used to detect attacks and normal scenarios. The CAIDA 2007 Dataset is used for experimental study. The machine learning algorithms are trained and tested using this dataset and the trained algorithms are validated. Weka data mining platform are used in this study for implementation and results of the same are analysed and compared. Other machine learning algorithms used with respect to denial of service attacks are compared with the existing work.
Introduction
A denial of service (DoS) attack is a sort of cyberwarfare in which malicious users prevent genuine applications from accessing network infrastructure. They try to drain the victim system's resources and cause network congestion by creating a massive amount of traffic in the targeted system's area without capturing vital information or compromising credential files. The massive amount of data created makes it impossible for each packet to reach its destination. A three-way handshake is necessary to establish a network connection in most cases. The client establishes a connection between client and server, which the server acknowledges after receiving the client's request and assigning capacity inside the reservoir connection. Ultimately, the recipient validates the connectivity, indicating that the process has been completed. The perpetrator establishes significant similarities and transmits photons as expected, but never hears the provider's final affirmation notification. Consequently, the relationship almost never increases wealth, exposing the host to the reservoir space reserved for all unfinished transactions. If the critical success factors are met, the server's buffer will be brimming with unresolved attachments, leaving little room for acceptable TCP connections, effectively prohibiting the server from undertaking a DoS strike. An endeavour to restrict authorised users from accessing a targeted machine network and information capabilities is referred to as a DoS attack. Because of the limitations of conventional networking devices, the diversity of attack strategies, and the programmers' opacity towards host sites, DDoS attacks are the most difficult security problems to identify, mitigate, and trace today. DDoS attacks can be mitigated by enforcing strict security standards and deploying an appropriate approach, including firewalls and vendor-specific workarounds.
As mentioned in Singh KJ et al., a DDOS assault scenario is depicted in Fig. 1 where the attacker infects a reliable system under Command and Control (C & C) is accomplished by infecting a computer with a Trojan virus via malicious software (2015). BOTS refers to infected systems controlled by the attacker. Mc Gregory S et al. dubbed the connectivity of these BOTS BOTNETS (2013). These BOTNETS, such as HTTP or P2P, are explained well by Sheng L et al. (2012), and are used by the attacker through C & C. If BOTNETS are in place, the attacker can gain complete control of the machines by sending well-executed commands to each bot via remote control. Once the botnet has tracked or targeted the end-IP user's address, each bot will begin working on it to reply by transferring requests to the targeted computers, most likely causing a delay. Botnet detection techniques often include either putting up a phishing attack to harvest malware components or establishing a detection algorithm. The network intrusion detection system monitors system and network logs to uncover malicious operations. Suspicious types of behaviour, biometrics, or nameservers could all be exploited. There really are numerous explanations why it is that a botnet is used to perform a DDoS attack, which includes, for example, a significant number of zombie connections that facilitate the constant transformation of severe attacks and threats, Difficulty represents the main wrongdoer, and the flexibility to exploit guidelines to do something about protective measures. It is difficult to distinguish between real and virtual time. Bots are the malicious systems of the user as shown in Fig. 1 which are hacked by the attackers ultimately resulting in the reduction of the processing time of the server. The appropriate solution to this issue that can be suggested is BOTNETS.

DDOS Attack Scenario on Victim Server
The major goal of this paper's work is to distinguish between normal and attack scenarios by analysing the throughput of the data packets respectively. In this course, the throughput threshold is calculated in order to differentiate between normal and attack scenarios. To make further analysis more effective, machine learning algorithms like logistic and naive bayes are applied to the CAIDA 2007 datasets. Logistic regression is used majorly for predicting purposes, which is our main goal, and naive bayes based on the Bayes theorem gives better accuracy by assuming the independent features of the variables. Mathematical modelling is framed in order to derive the relationship between the data packets' inter-arrival time and throughput, as reported by CAIDA.
The following is a summary of the work in this paper: “Literature survey” section examines similar work in the field of DDOS attacks and conducts a comparative analysis. The proposed methodology for identifying DDOS attacks is discussed in “Proposed methodology for the identification of DDoS attacks” section, followed by a mathematical model and a machine learning model. ”Conclusion and Scope for Further Enhancement” section summarises the findings of the experimental models and provides a brief summary of the findings. In “Declarations” section, the work finishes with a full description of the study conducted in this paper, as well as future directions and references in “References” section.
Literature survey
Of these, DDoS (Distributed Denial of Service) operations are one of the most prominent, having a negative effect on server functionality and inflicting substantial damage. In a DDoS assault, the malicious user exploited workstations (acknowledged as corpses) to broadcast a large number of requests from either of these just-now undead to a destination by leveraging defined or unannounced potential vulnerabilities. It would demand a significant amount of data transmission or computing time from either the victimised virtualized environment. This study developed a DDoS detection method based on the C.4.5 methodology and countered the DDoS threats. Once supplemented with trademark identification techniques, this approach provides a classification tree that immediately and adequately diagnoses characteristic forgeries for Dos and ddos strikes [1]. [2] introduces a DDoS attempt warning system based on deep neural networks (Deep Defence). Technological advances have allowed for comprehensive modelling and inference by extracting relevant high-level traits from average ones. It is the establishment of a continuous recurrent neural network well with the aim of understanding commonalities from network activity cycles and tracing network attack activities. The experimental findings demonstrate that we are getting closer and closer to traditional machine learning models. When compared to a traditional machine learning approach, the inaccuracy rate is reduced from 7.517 percent to 2.103 percent in a bigger data set. [3] describes ArOMA, an autonomous DDoS prevention infrastructure that takes advantage of the governmental or political and highly centralised manageability possibilities of the Software Defined Networking (SDN) framework. ArOMA, in particular, has the opportunity to comprehensively break down the barriers between diverse security operations, including monitoring systems, anomaly detection, and mitigating measures, while eliminating the need for non-trivial human participation. It also encourages ISPs and their customers to collaborate on DDoS mitigation by logically spreading critical security functions across the ISP, allowing the ISP to tackle DDoS traffic according to the needs of its consumers. Our findings show that ArOMA can efficiently maintain streaming server performance at a tolerable level even in the presence of high-rate DDOS attacks. In an experiment [4], machine learning techniques were investigated for recognising swarm DDoS attacks. The UNBS-NB 15 and Privation exposure datasets, which are well-known for recognising malware DDoS attacks, were used in the analysis. Machine learning methods such as Support Vector Machine (SVM), Artificial Neural Network (ANN), Nave Bayes (NB), Decision Tree (DT), and Reinforcement Classification are used to start investigating the accuracy, number of false positives (FAR), sensitivity, specificity, false positive rate (FPR), AUC, and Matthews correlation coefficient (MCC) of datasets (USML). The performance of the KDD99 dataset has been shown to be superior to that of the UNBS-NB 15 dataset. This evaluation is crucial in computer security and certain other related fields.
[5] recommends the DBod botnet detection method, which is based on the binary mixture, based on an assessment of the querying pattern of network activity. The proposed method takes advantage of the fact that hosts infected with the same partial fulfilment of the requirements ransomware query the very same sets of domains throughout the domain list, with an overwhelming percentage of these inquiries failing since only a tiny percentage of these domains are genuinely associated with an active C&C. The practicality of the proposed strategy is evaluated using DNS data collected over a 26-month period from an educational network environment. The findings show that DBod is capable of efficiently and accurately detecting both traditional and prospective decision outcome botnets continuously in real connections. [6] investigated classification algorithms for recognizing network Cyberattacks in an experiment. The UNBS-NB 15 and KDD99 publicity datasets, which are well-known for identifying malware DDoS attacks, were used in the analysis. Machine learning methods such as Convolutional Neural Network (SVM), Multilayer Perceptron (ANN), Naive Bayes (NB), Decision Tree (DT), and Reinforcement Classification are used to investigate the accuracy, false alarm rate (FAR), sensitivity, specificity, false positive rate (FPR), AUC, and Matthews correlation coefficient (MCC) of datasets (USML). The effectiveness of the KDD99 dataset has been shown to be superior to that of the UNBS-NB 15 dataset. This validation is crucial in cryptography and other relevant disciplines. [7] proposes a machine learning botnet detection model and evaluates its performance using standard machine learning approaches and Domain Name Service query data. According to empirical observations, machine learning approaches may be useful in botnet detection, with the random forest algorithm producing quality overall detection results of over 90%. To protect the SDN-based cloud from flow table overloading DDoS attacks, [8] proposes a novel flow-table sharing approach. Using the idle flow-tables of other OpenFlow switches on the network, this strategy prevents the switch's flow-table from overloading. Our provision of facilities and services reduces the cloud system's susceptibility to data breaches with minimal involvement from the SDN controller. As a result, communication overhead is kept under control. Our predictions are supported by the vast majority of three-dimensional computer research. With 7.3 trillion bot requests analysed in the fourth quarter of 2017, there was a dramatic increase in the use of malware attacks for credentials abuse, signalling that 40% of password resets were illegitimate. Remote code execution weaknesses, particularly in enterprise software, have recently been a favourite target for attackers aiming to enslave machines for botnets. The Go Ahead embedded HTTP server, which offers 700,000 potential targets, and the Access The Cloud Server are two of the most prominent targets attacked by cybercriminals [9]. For clarification, [10] is based on the study line "Why? What? How?" Firstly, we'll go over why aggressive engagement is so important. After that, the concepts, types, and dangers of adversary warfare are discussed. Finally, we go over the most frequent attack algorithms and the basis of these factors in each application area. Faced with the growing complexity of the neural network model, this paper focuses on the domains of photos, text, and corrupted files, as well as the crown prosecution categorization and methodologies of these different information sources, allowing researchers to quickly choose their own type of research. At the conclusion of this review, significant discussions and unresolved difficulties are raised and referenced towards other similar examinations. [11, 17], and [18] advocated adopting Dempster's tandem rule to investigate mixed proof of various types of cloud strikes in Pakistan's IT business. [12, 16] propose a structural interpretation learning framework that employs machine learning techniques to classify botnets and benign programmes based on botnet-specific patterns of ready to fully and attributes. The selected patterns have been tested using legitimate evaluation metrics and have been shown to have great detection accuracy and a low false positive rate. In both experimental and statistical tests, the support vector machine classifier beats conventional classification approaches. [13, 14], and [15] provide an online consecutive tractor trailer ML solution for DDoS detection based on network entropy estimate, founder, information gain ratio, and the Extra-Trees algorithm. The approach's unsupervised feature decreases the quantity of superfluous normal traffic information used in DDoS detection, which lowers false positive rates and increases the accuracy. The supervised portion, on the other hand, ensures that the unsupervised part's false positive rates are reduced and that DDoS traffic is correctly classified. Various experiments were carried out to test the suggested technique utilising three datasets: NSL-KDD, UNB ISCX 12, and UNSW-NB15. 98.23%, 99.88%, and 93.71 percent, respectively, with positive result rates of 0.33 percent, 0.35 percent, and 0.46 percent.
Furthermore, [19, 20], and [21] investigated DDoS attacks in depth and evaluated the reduced feature set based upon that domain expertise to drastically enhance accuracy. [21] tested and analysed the NSL-KDD dataset with an altered feature set and discovered that our recommended NIDS can detect 99.1 percent of DDoS attacks. Our findings were compared to those of other studies. [22] uses the PCA methodology to minimise the dimension of the features and, hence, the detection time complexity. PCA provides for a significant decrease in prediction time while maintaining the preponderance of the original data. The data is placed into an RNN to train and generate a detection model again when the dimensions have been decreased. The evaluation findings show whether PCA-RNN may achieve significant performance gains in terms of accuracy, sensitivity, precision, and F-score for the real dataset when compared to different available DDoS attack detection technologies. In an experiment, [23] tested machine learning methods for recognising network DDoS attacks. The UNBS-NB 15 and KDD99 publicity datasets, which are well-known for detecting botnet DDoS attacks, were used in the analysis. Machine learning methods such as Support Vector Machine (SVM), Artificial Neural Network (ANN), Naive Bayes (NB), Decision Tree (DT), and Unsupervised Classification are used to investigate the accuracy, number of false positives (FAR), attentiveness, thoroughness, misclassification rate (FPR), area under the curve, and Matthews correlation analysis (MCC) of datasets (USML). The performance of the KDD99 dataset has been shown to be superior to that of the UNBS-NB 15 dataset. This validation is crucial in information security and other allied subjects. [24] tested machine learning methods for spotting botnet intrusions in an experiment. In an experiment, [23] tested machine learning methods for recognising network DDoS attacks. The UNBS-NB 15 and KDD99 publicity datasets, which are well-known for detecting botnet DDoS attacks, were used in the analysis. Machine learning methods such as Support Vector Machine (SVM), Artificial Neural Network (ANN), Naive Bayes (NB), Decision Tree (DT), and Unsupervised Classification are used to investigate the accuracy, number of false positives (FAR), attentiveness, thoroughness, misclassification rate (FPR), area under the curve, and Matthews correlation analysis (MCC) of datasets (USML). The performance of the KDD99 dataset has been shown to be superior to that of the UNBS-NB 15 dataset. This validation is crucial in information security and other allied subjects. [24] tested machine learning methods for spotting botnet intrusions in an experiment Table 1. The characteristics of the instruments that are regularly used to process large amounts of data are represented in Table 2. Table 3 contrasts machine learning methods and associated deployments to see which ones are best for the study's specifications.
Proposed methodology for the identification of DDoS attacks
A DDoS is a type of cyberattack that uses the power of a large number of malware-affected systems to disrupt network connectivity or service, resulting in a denial of service for users of the targeted resource. In this work, two models are proposed to identify DDoS attacks: (i) A Mathematical Model (ii) A Machine Learning Model. The proposed mathematical model derives the relationship between the inter-arrival time of requests and throughput. Further throughput analysis was carried out to identify DDoS attacks. Logistic Regression and Naive Bayes models are used to build machine learning models to identify DDoS attacks.
Mathematical model for identifying DDoS attacks
The system's quantitative behaviour can be estimated using a mathematical model. In order to discover the model's strengths and limitations, quantitative findings from mathematical models may be easily compared to observational data. So, a mathematical model is proposed in this section in order to identify DDoS attacks. The most significant characteristics for determining assaults are bandwidth and throughput, where bandwidth represents how much data can be moved across a communications channel and the amount of data successfully transmitted from source to destination is measured by throughput.
The probability of bandwidth depletion given in Eq. 1 is the base formula which is used to derive the relationship between the inter-arrival time of the requests and throughput. Equations 4, 5 and 6 show the final results of the derivations where inter-arrival time and throughput are inversely proportional to each other. Throughput is calculated using Eqs. 8 and 9, the values of which are listed in Table 4. All the notations used while framing mathematical formulas are listed in Table 4.
The probability for calculating consumption in terms of bandwidth is given by:
where α = ( βAB + βLB) / βTotal
C – No. of open or unused bandwidth.
Let’s assume the size of the packet is the same in both cases, such as attack as well as normal traffic, i.e.
TPA = TPLB = TB, then we have.
α = TB/βTotal [ 1/IAB + 1/ILB], ( α is Average of Bandwidth).
α = K * 1/IAB, K = TB/βTotal, where K is constant and 1/ILB 0
Equations 1 and 4 can be used to deduce the following conclusions:
Based on the findings reached from Eqs. 5 and 6, the attacks are detected via determining the arrival time of two adjacent data packets referred as inter arrival time 6. A sliding window of 10 s is used to analyse this arrival time. The formula in Eq. 7 is used to calculate the mean inter-arrival time.
where IPArrivalTime denotes the IP address' inter-arrival time in a sliding window of 10 s.
Poisson distributions are used for attack packets and Gaussian distributions for ordinary clients. In this work, CAIDA datasets 2007 is used for real time estimation by analysing the throughput and inter arrival time of the attack and normal scenario simultaneously. The formula used in this process is highlighted in Eq. 8 & 9.
Or
20,090 distinct IP addresses are considered for each 10 s gap. Throughput, Frequency of arrival, and Inter-arrival Time for both attack and normal scenarios are analysed in Table 2. A part of the datasets can be viewed in the respective tables.
Table 5 contains details about the attack scenario, such as data packet inter-arrival time, throughput, and frequency, source IP address, destination IP address, and protocol. Table 3 shows the following observations:
-
The Median value is considered as the throughput threshold (i.e. 755.97).
-
Throughput above the threshold is considered as high and is categorised as an attack.
-
Throughput below the threshold is considered as low and categorised as normal.
-
The Miss Rate for the mathematical model is 0.0025, which is acceptable. A False negative is the probability that a true positive will be missed by the mathematical model. It is given as:
Miss Rate = FN / FN + TP.
True positive (TP) = 20,038 ( Correctly Predicted).
False Negative (FN) = 52.
Miss Rate = 52/20090 = 0.0025.
Mathematical model are taking CAIDA 2007 datasets which is real time datasets especially consisting denial of service information. Mathematical model focus on predicting between attack and normal data by analysing the throughput and the frequency of that particular information. It’s like more throughput, means more time for processing data and more time for processing data does not allow the genuine clients to take the control and fulfill their requirement of processing and enabling it to be in queue for infinite durations. Validation with respect to miss rate is also performed to analyse the correctness of the mathematical model considering CAIDA DATASET.
Machine learning model for identifying DDoS attacks
Activity diagram for the experimental model
The activity diagram for the experimental model is shown in Fig. 2 and the procedure for the same is as follows:
-
1.
CAIDA 2007 dataset is considered for the calculating the threshold of the throughput in order to categorize the normal and attack scenarios. The throughput of the data is compared with the threshold. Throughput above the threshold is categorised as an attack, else normal. Later, the ML model such as logistic regression and naïve bayes is used to further validated the proposed model. The Median of the CAIDA 2007 Dataset is considered as the throughput threshold.
-
2.
Two machine learning models are built; (i) using Logistic regression and (ii) using Naive Bayes. In general, logistic regression is used for prediction analysis. Since the main focus of the work in this paper is predicting DDoS attacks, the logistic algorithm suits well. In general, Naive Bayes assumes conditional independence for all features. As a result, if some of the features are in fact interdependent (as in the case of a huge feature space), the prediction may be inaccurate.
-
3.
The original dataset consisting of 20,090 records is categorized into a 70:20:10 ratio. That is, 70% of the data (140,063) is considered as training data, 20% of the data (5425) is test data and the rest of 10% of the data (602) is used for cross validation purposes.
-
4.
Employees are monitored based on successfully identified occurrences, incorrectly diagnosed cases, sharpness, retention, totally false positive frequency, classified as positive percentage, and coefficient of determination of mistake. The total of the Positive Class and Genuine Positive Rates is Appropriately Recognized Occurrences. Consequently, the aggregate of the False Positive (FP) and False Negative (FN) percentages equalled Inconsistently Labelled Situations. The quantity of appropriately diagnosed examples multiplied by the number of instances yields correctness.
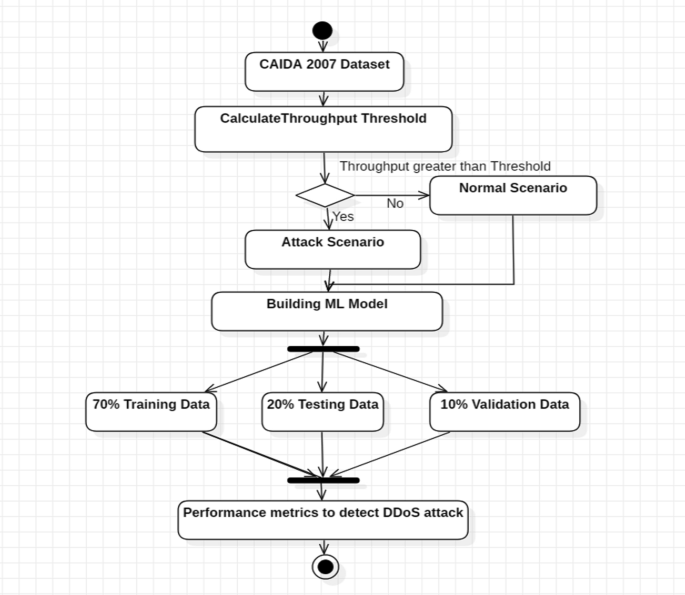
Activity Diagram for experimental model
Results and discussion
This section contains the results of the experimental model using machine learning algorithms such as logistic regression and naive bayes. Weka tool is used for fetching the experimented results. Additionally, by subsampling the data, non-incremental learning methods can be used on large datasets. Weka also provides Hadoop and Spark compatibility as options for distributed data mining. The distributed Weka Base package contains base "map" and "reduce" activities that are not dependent on any particular distributed platform.At a high level, the major distinction between Weka and the others is flexibility. Weka is a plug-and-play machine learning solution; it's packed in a.jar file and comes with a graphical user interface (GUI) via which you can perform most basic analyses and model development. Weka provides more instruction than the others, which are interactive shell languages, and running ML through Weka appears to be rather magical. As a result, Weka is less flexible than the others for statistical analysis and data exploration. The difference is that the others are programming languages with ML packages and libraries that you can import, whereas the others are not. On the other hand, Weka is a machine learning package. As you might expect, this implies that the others give you a lot more freedom to clean, analyse, and alter your data sets, as well as a lot more ability to control and tweak the underlying algorithms. Further, the performance of the experimental model is analysed. Weka is licenced under the GNU General Public License, making it free to use. Because it is written entirely in Java, it can run on nearly any modern computing platform. It is a collection of data preparation and modelling methods. Weka has some disadvantages in the sense that it is only capable of handling small datasets. An Out Of Memory problem happens whenever a set is larger than a few megabytes.
Figure 3 shows the experimented results using logistic regression machine learning model on the training dataset. Figure 4 shows the experimented results using logistic regression machine learning model on the test dataset and Once testing on the proposed model is successfully completed, cross validation using logistic regression on the rest 602 instances is performed in order to test the model’s ability to predict attack and normal scenario using new set of data that was not used in the training and testing datasets as shown in Fig. 5.

Detailed Accuracy for Training Dataset using Logistic Machine Learning Algorithm

Detailed Accuracy for Test Dataset using Logistic Machine Learning Algorithm

Detailed Accuracy applying Cross Validation using Logistic Machine Learning Algorithm
Figure 6 shows the experimented results using naïve bayes machine learning model on the training dataset. Figure 7 shows the experimented results using naïve bayes machine learning model on the test dataset and once testing on the proposed model is successfully completed, cross validation using naïve bayes on the rest 602 instances is performed in order to test the model’s ability to predict attack and normal scenario using new set of data that was not used in the training and testing datasets as shown in Fig. 8. From the above implementation and summary of the results for the experimental model using logistic regression and naïve bayes as shown in Table 6.

Detailed Accuracy for Training Dataset using Naive Bayes Machine Learning Algorithm

Detailed Accuracy for Test Dataset using Naive Bayes Machine Learning Algorithm

Detailed Accuracy applying Cross Validation using Naive Bayes Machine Learning Algorithm
The observations drawn from Table 4 and Fig. 9 are as follows:
-
Accuracy using Logistic regression ranges from 99 to 100% and naive bayes ranges from 99 to 98%. Thus, logistic regression fetched better results as compared to naive bayes.
-
The MAE using logistic regression is 0, 0.0015, 0.0017, whereas the MAE using naive bayes is 0.007, 0.006, 0.0163. Thus, the results of logistic regression are also better than naive bayes in terms of mean absolute error, as the MAE value is the minimum in logistic regression.
-
The recall value using the logistic regression algorithm for the attack scenario is 0.997 and for the normal scenario is 1.000. The recall value using the naive bayes algorithm for the attack scenario is 0.974 and for the normal scenario is 1.000. This means the difference between the recall value for attack and normal scenario is less in logistic but considerably better in naive bayes. The characteristics of Naive Bayes are also considered to be conditionally independent. Though real data sets are never entirely independent, they can come close. In conclusion, compared to logistic regression, Naive Bayes has a higher bias but smaller variance. Naive Bayes is a superior classifier if the data set follows the bias. Both Naive Bayes and Logistic Regression are linear classifiers. However, Logistic Regression produces a probability prediction using a direct functional form, whereas Naive Bayes determines how the data was formed based on the findings.
-
The Precision value using logistic regression and naive bayes are the same, i.e. 1.000. Thus, detecting DDoS in terms of precision is not enough. Other parameters like accuracy, recall, MAE are required for analysis of the performance metrics.

Graphical comparison of the logistic regression and naive bayes algorithm
Conclusion and scope for further enhancement
The work in this paper started by deriving and analysing the relationship between the arrival time of the requests and throughput using the CAIDA dataset 2007. It is observed that the inter-arrival time of the requests is inversely proportional to the throughput. A mathematical model and a machine learning model have been proposed to identify DDoS attacks. Machine learning algorithms such as logistic regression and Naive Bayes are used to determine the performance of the metrics where logistic regression fetched good results as compared to Naive Bayes. It is also observed that the performance of machine learning models is slightly better than mathematical models. The accuracy of the machine learning model is 100% and the mathematical model is 99.75%.
The work done in this paper helps in identifying DDoS attacks in a simpler and more efficient manner. It even highlights the performance of machine learning algorithms as a comparative study was conducted between logistic regression and naive bayes. Real-time datasets are used for efficient analysis. Since logistic regression and naive bayes fetched good results, they were preferred. Both machine learning and mathematical models have to be tested for live attacks. This paper's findings can also be used to avoid attacks on memory management and firewalls. The presented model acquired findings from a single dataset, which serves as a limitation of the model. Consequently, a distributed dataset can be examined in order to provide directions for future enhancements.
Availability of data and materials
The Data will not be shared as the credentials to access the raw DDoS datasets are provided by CAIDA on an individual basis and its confidential. The link to their website is https://www.caida.org.
References
Zekri M, Kafhali S, Aboutabit N, Saadi Y, “DDoS attack detection using machine learning techniques in cloud computing environments”, 3rd international conference of cloud computing technologies and applications (CloudTech), pp 1–7,2017. hthttps://doi.org/10.1109/cloudtech.2017.8284731.
Xiaoyong Yuan, Chuanhuang Li, Xiaolin Li, “DeepDefense: Identifying DDoS Attack via Deep Learning”, IEEE International Conference on Smart Computing (SMARTCOMP), 2017.
Sahay R, Blanc G, Zhang Z, Debar H. Aroma: an SDN based autonomic DDoS mitigation framework. Computer Security. 2017;70:1–18. https://doi.org/10.1016/j.cose.2017.07.008.
Antonakakis M, April T, Bailey M, Bernhard M, Bursztein E, Cochran J, Kumar D, .Understanding the miraiBotnet. USENIX security symposium, 2017.
Wang TS, Lin HT, Cheng WT, Chen CY. “DBod: Clustering and detecting DGA-based botnets using DNS traffic analysis. Computer Security. 2017;64:1–15.
Ali ST, Mc Corry P, Lee PHJ, Hao F. Zombie Coin 2.0: managing next-generation Botnets using Bitcoin. Int J Inform Security. 2017;17:411.
Hoang X, Nguyen Q. Botnet detection based on machine learning techniques using DNS query data. Future Internet MDPI. 2018;10(5):43.
Bhushan K, Gupta BB. “Distributed denial of service (DDoS) attack mitigation in software defined network (SDN)- based cloud computing environment. J Ambient Intell Humaniz Comput. 2018. https://doi.org/10.1007/s12652-018-0800-9.
Tom Ball. Malicious Botnets responsible for 40% of global login attempts. 2018. https://www.cbronline.com/news/malicious-botnets-login
Cao N, Li G, Zhu P, Sun Q, Wang Y, Li J, Zhao Y. Handling the adversarial attacks. J Ambient Intell Humaniz Comput. 2018;10:2929–43.
Pillutla H, Arjunan A. Fuzzy self-organizing maps-based DDoS mitigation mechanism for software defined networking in cloud computing. J Ambient Intell Humanize Computation. 2018. https://doi.org/10.1007/s12652-018-0754-y.
Kirubavathi G, Anitha R. Structural analysis and detection of android Botnets using machine learning techniques. Int J Inf Secur. 2018;17(2):153–67.
Idhammad M, Karim A, Belouch M. Semi-supervised machine learning approach for DDoS detection”. Appl Intell. 2018. https://doi.org/10.1007/s10489-018-1141-2.
Doshi R, Apthorpe N, Feamster N. Machine learning DDoS detection for consumer internet of things devices. IEEE Security and Privacy Workshops (SPW). 2018. https://doi.org/10.1109/SPW.2018.00013.
Co N, Li G, Zhu P, Sun Q, Wang Y, Li J, Zhao Y. Handling the adversarial attacks. J Ambient Intel Humaniz Comput. 2018;10:2929–43.
Homayoun S, Ahmadzadeh M, Hashemi S, Dehghantanha A, Khayami R. BoTShark: a deep learning approach for Botnet traffic detection. In: Dehghantanha A, Conti M, Dargahi T, editors. Cyber threat intelligence advances in information security. Cham: Springer; 2018. p. 137–53.
Jha S, Kumar R, Son L, Abdel-Basset M, Priyadarshini I, Sharma R, Long H. Deep learning approach for software maintainability metrics prediction. IEEE. 2019;7:61840–55.
Pritam N, Khari M, Son L, Kumar R, Jha S, Priyadarshini I, Abdel-Basset M, Long H. Assessment of code smell for predicting class change proneness using machine learning. IEEE. 2019;7:37414–25.
Son NTK, Dong NP, Long HV, Son LH, Khastan A. Linear quadratic regulator problem governed by granular neutrosophic fractional diferential equations. ISA Trans. 2019. https://doi.org/10.1016/j.isatra.2019.08.006.
Khan MMT, Singh K, Son LH, Abdel-Basset M, Long HV, Singh SP, “A novel and comprehensive trust estimation clustering based approach for large scale wireless sensor networks”. 2019. IEEE. pp. 58221–58240.
S Das, Ahmed M. Mahfouz, D Venugopal, S Shiva, “DDoS Intrusion Detection Through Machine Learning Ensemble”, IEEE 19th International Conference on Software Quality, Reliability and Security Companion (QRS-C), 2019.INSPEC Accession Number: 19045598.
Li Q, Meng L, Zhang Y, Yan J. DDoS attacks detection using machine learning algorithms. In: Zhai G, Zhou J, An P, Yang X, editors. Digital TV and multimedia communication: 15th international forum, ifTC 2018, Shanghai, China, September 20–21, 2018, revised selected papers. Singapore: Springer; 2019. p. 205–16.
Ceron J, Jessen K, Hoepers C, Granville L, Margi C. Improving IoT Botnet investigation using an adaptive network layer. Sens MDPI. 2019;19(3):727.
Tuan TA, Long HV, Son LH, Kumar R, Priyadarshini I, Son NTK. Performance evaluation of Botnet DDoS attack detection using machine learning. Evol Intell. 2020;13:283–94.
Acknowledgements
Not applicable.
Funding
The authors did not received any funding.
Author information
Authors and Affiliations
Contributions
KK is responsible for the content of this work along with the collection of the datasets from CAIDA which was later approved by MM. All authors read and approved the final manuscript.
Corresponding author
Ethics declarations
Ethics approval and consent to participate
Not applicable.
Consent for publication
Not applicable.
Competing interests
Not applicable.
Additional information
Publisher's Note
Springer Nature remains neutral with regard to jurisdictional claims in published maps and institutional affiliations.
Rights and permissions
Open Access This article is licensed under a Creative Commons Attribution 4.0 International License, which permits use, sharing, adaptation, distribution and reproduction in any medium or format, as long as you give appropriate credit to the original author(s) and the source, provide a link to the Creative Commons licence, and indicate if changes were made. The images or other third party material in this article are included in the article's Creative Commons licence, unless indicated otherwise in a credit line to the material. If material is not included in the article's Creative Commons licence and your intended use is not permitted by statutory regulation or exceeds the permitted use, you will need to obtain permission directly from the copyright holder. To view a copy of this licence, visit http://creativecommons.org/licenses/by/4.0/.
About this article

Cite this article
Kumari, K., Mrunalini, M. Detecting Denial of Service attacks using machine learning algorithms. J Big Data 9, 56 (2022). https://doi.org/10.1186/s40537-022-00616-0
Received:
Accepted:
Published:
DOI: https://doi.org/10.1186/s40537-022-00616-0