- Case study
- Open access
- Published:
Evaluation of the trends in jobs and skill-sets using data analytics: a case study
Journal of Big Data volume 9, Article number: 32 (2022)
Abstract
Introduction
Fast-emerging technologies are making the job market dynamic, causing desirable skills to evolve continuously. It is therefore important to understand the transitions in the job market to proactively identify skill sets required.
Case description
A novel data-driven approach is developed to identify trending jobs through a case study in the oil and gas industry. The proposed approach leverages a range of data analytics tools, including Latent Semantic Indexing (LSI), Latent Dirichlet Allocation (LDA), Factor Analysis and Non-Negative Matrix Factorization (NMF), to study changes in the market. Further, our approach is capable of identifying disparities between skills that are covered by the educational system, and the skills that are required in the job market.
Discussion and evaluation
The results of the case study show that, while the jobs most likely to be replaced are generally low-skilled, some high-skilled jobs may also be at risk. In addition, mismatches are identified between skills that are imparted by the education system and the skills required in the job market.
Conclusions
This study presents how job market and skills required evolved over time, which can help decision-makers to prepare the workforce for highly demanding jobs and skills. Our findings are in line with the concerns that automation is decreasing the demand for certain skills. On the other hand, we also identify the new skills that are required to strengthen the need for collaboration between minds and machines.
Introduction
Emerging technologies, such as Artificial Intelligence (AI), Machine Learning (ML) and robotics have accelerated the march towards widespread automation in many industries and domains. This trend has become increasingly apparent over the past decade, where the performance of AI systems have exceeded that of humans in a growing list of applications [1]. Such disruptive technologies started transforming our lives in many ways. The impact on the nature of work and on the skills that are required in the job market, is particularly notable. Even “knowledge-based” jobs are not exempt, as is evidenced by a recent study where an automated medical diagnosis system was shown to be as accurate as the best physicians [2]. Accordingly, in this study, we analyze the oil and gas industry where cognitive skills may have more value when compared to manual routine skills.
Earlier studies have concluded that low skilled jobs requiring manual labour are being replaced by machines and automation [3,4,5,6,7]. Due to this reason, there has been a significant drop in the demand for such skills over the last decade. On the other hand, the same studies have discovered that interpersonal skills and social activities which consist of skills like emotional intelligence, caring for others, creativity are seeing increasing demand.
The benefits of automation are not limited to manual work; AI agents can now act as negotiators in e-commerce [8], while automation has greatly enhanced assistive technologies for old people [9]. There has been a dramatic increase in the demand for AI skills over 2010-2019 in the US economy across most industries [10]. Indeed, computers are supplanting human labour in an increasing variety of cognitive tasks [11]. Due to these reasons, the ability to analyze and anticipate changes in the skill sets required for future jobs is critically important, and will have major implications on public and HR policies and even the educational system. This will also help in creating general awareness about the impact of automation and AI on the demand for certain skills in the job market.
It seems clear that insights about job market trends can be extremely valuable to job-seekers, employers and policymakers, particularly that during challenging eocnomic times in the economy [12]. By analyzing how skills change over time [13], researchers focus on variations in the skills composition of various jobs, widely know as intensive analysis. However, studying the extensive margin, i.e. variations in the demand and distribution of jobs, is also of equal importance. For example, the study of extensive margin changes can be very helpful for Human Resource (HR) employees for getting relevant insights about hiring, and will ultimately help a company in tackling its turnover issues. This will eventually lead to an improvement in the retention rate of the company and hence it may attract more of the talent which is very significant for the company’s growth in the long run. This is particularly important in the oil and gas industry as this industry boasts of being among the top ten sectors when it comes to the Talent Turnover Rate [14].
The studies mentioned above have extensively discussed the problem, however, there is still a lack of any comprehensive study which focuses on the mismatch between the skills required in the job market and the skills which are imparted by the current education system. Besides, there is a deficit of studies which specify the change magnitude of such skills and what the actual demand is from the job market [15]. Due to these reasons, it becomes very crucial to evaluate jobs and workforce to find out the mismatch between the skill sets endowed by education and the demand in the job market. If we focus on these questions, we will be better off in predicting the skills which will be in higher demand.
The objective of this research paper is to fill the gaps mentioned earlier with the help of a model which uses multiple data science techniques to develop a framework that can provide significant insights for strategic decision-making. This will further help in enhancing the capability of a policymaker or an HR to establish a match between jobs and the corresponding skill sets. To achieve the aforementioned, this research endeavors to answer the following research questions along with using data science techniques for oil & gas industry.
-
1.
What are the skill factors most affected by a rapid advancement of technology, i.e. AI advancement?
-
2.
What will be the new emerging skills if the current skill sets will lose relevance?
-
3.
If such changes occur, what will be the corresponding impact on the job market in the oil & gas industry? Hence, what could be the role of the Federal government to tackle these challenges?
This section presents the research problem and the literature review, the rest of the paper is structured as mentioned. Section "Case description" talks about the applied methodology and walks us through the development of the framework. Section "Results" presents the study results. Section "Discussion and evaluation" provides a comprehensive discussion of the results. Section "Conclusion" talks about the limitations of the study. The same section contains the conclusion while providing recommendations for further studies in the future.
Case description
In this study, data mining techniques were used to analyze the changes in the skill sets required and job market demand in the oil & gas sector. These techniques are discussed and explained further in the subsequent sections.
Data mining
To analyze our research questions, we collected unstructured textual data. Then, we made use of Natural Language Processing (NLP) to derive all the necessary information from the extracted text. This process is commonly known as “Text Mining”. Text mining methods have many fields of application. Some of them are mining of electronic health records [16], text mining of online news to perform sentimental analysis [17], predicting component failures [18], etc.
Data collection
We used scraping, which is a data mining technique for the collection of data. Publicly accessible data from the internet can be collected using the scraping technique. First of all, we explored and decided to choose the best websites with job postings. Then to ensure that the mined data is diversified, we collected data from various website sources. This guarantee that the collected data approximately represents the overall job market in the sector we are targeting to study. In our study, ‘demand’ represents the employers who are in search of employees with a particular skill set. We also studied the ‘supply’ side, which corresponds to the comprehensive analysis of various faculty courses i.e. the skill sets imparted into students till graduation. So by the help of data analytics, we will be finding the gap existing between the skills sets imparted into students by faculty courses and the skill sets which are in demand in the market. Later, these observations after the analysis can be very useful for the future knowledge-based policymakers in making informed decisions for education and training.
The data collection procedure started with extracting specific information from the chosen websites, so to achieve this goal we used the python libraries Beautiful Soap and Regular Expression. Job postings available on these websites provide a rich source of real-time and detailed data on the qualifications and skills sought by employers across industries, occupations and locations [19]. Each job consists of many features such as salary, company name, required skill set, etc. but for our study, we focused on the title and description of the job. Utilizing the above-mentioned libraries we were able to get refined and relevant data according to our requirements for performing the analysis.
Job postings that we collected belong to a period from July 2015 to June 2018. The data collected were for oil & gas sector in the GCC countries consisting of United Arab Emirates (UAE), Saudi Arabia, Oman, Qatar, Bahrain and Kuwait and USA (Texas, California, Louisiana, Oklahoma, and Pennsylvania). For the same period, corresponding data to the syllabuses of the academic courses were collected. The data was collected from the recognized educational institutions in the United Arab Emirates for the oil & gas sector.
The next step was to standardize the data which was collected from various websites. In order to achieve this, we used the Occupational Information Network (O*NET)Footnote 1. O*NET is one of the primary sources of occupational information for researches involving job analysis. The O*NET database provides comprehensive information on over 1110 occupations, and for each of such occupations, there are hundreds of standardized and occupation-specific descriptors [15]. To identify the change of skills during years, abilities, task statements, and work activities were used from the ONET. Finally, using this full description information, it was possible to match jobs gathered from the Web with the O*NET occupations.
The choice of oil & gas industry and data from academia for oil & gas sector was primarily due to the reason that this sector holds immense importance in the GCC countries. In addition, gathering the data from GCC and USA countries ensured that the developed models are robust—this will further ensure that the models are independent of the geographical location where the data is collected. Also, it is well known that the O*NET database is a US-based program. To assure that the O*NET database is a good representation of not only US data but also GCC job market data is critical. Table 1 shows the exact number of job postings data we collected. It also mentions the data obtained from the academia about courses syllabuses in the oil & gas sector.
Data preprocessing
The conventional input in text mining is a document—term matrix. For the data we used, a document is synonymous to a job, and terms are words from the job description. Word frequency, which is the number of occurrences of a word in the document, signifies the importance of a word. Some words like English stop words generally have high frequency but they don’t have any additional information value. Hence we don’t include these in terms.
We followed the state of the art text mining techniques in order to pre-process our data [20, 21]. We removed the common words and expressions. This helped in reducing the size and noise. The pre-processing steps followed are described as follows:
-
1.
Tokenize Data
We first performed Tokenization. This refers to a process by which the text is split into significant tokens. Using the ideas from the reviewed literature [22], we did the tokenization step on our data. We converted our data into single word tokens and counted the frequencies of the words. O*NET data corpus produced a 1110 × 12964 matrix. The rows (records) represent the occupations and columns (features) represent unique words called tokens. The matrix thus produced was a sparse matrix. Few words were outliers and this was resolved as demonstrated in the next step.
-
2.
Removal of English Stop-Words
The most frequently occurring words which were mainly the English Stop-Words such as and, or, to, as, appeared almost in every record. Thus these words seemingly created no value. Hence these words were removed. This helped in reducing the matrix size too.
-
3.
Additional Filtering step
To avoid the issues of overfitting and underfitting, we removed all words that appeared in more than 90% of the occupations. This step can be termed as additional filtering. We tried different threshold percentages but 90% was the best in order to create a balance between underfitting and overfitting. The words that are too rare do not contribute much information about document similarity [23], hence we removed those who appear only in 1% of the documents. This step leads to further improvement in the generalization of the model and helps in significantly compressing the size of the matrix.
-
4.
Stemming
The process of removing morphological affixes from words such that only the word stem is left, is called stemming. For example, a Stemming algorithm reduces the words ‘working’, ‘works’, and ‘worker’ to the root word, ‘work’. So we deployed the stemming step and this resulted in the final matrix size of \((1110 \times 4655)\). The matrix density increased to 2.35%. The total number of unique words reduced to 4655 words. The word ‘equip’ which is stemmed from the word ‘equipment’ was the most frequent word after the preprocessing completion. It had a count of 2412 across all documents.
The preprocessing step mentioned above was described on the O*NET data in this paper, but the same pre-processing steps were also applied to the jobs data collected from the web and the academic data.
Models for intensive change analysis
The intensive change refers to changes in the task content within an occupation. If we analyze the variations in the composition of the jobs, we will be further able to investigate if they were being replaced by automation.
Factor analysis (FA)
From the O*NET database db_20_0, we collected 1110 occupations. The three job descriptors we used were Skills, Abilities, and Work Activities. We got \(954 \times 128\) matrix after consolidating based on the importance level from the descriptors mentioned earlier. Factor Analysis (FA) method is very helpful in describing the variability, called factors [24, 25]. In our data, we had 128 features. So by FA, we aim to find only several most informative unobserved or underlying features which can explain the entire features in our data. These underlying features are called latent or hidden features. This is very similar to Principal Component Analysis (PCA) [26] but the FA method also has independent and Gaussian distributed error terms associated with each input variable.
The importance of a skill n at time t as a function of the importance of all skill’s involved at a prior point of time \(t-1\) is being defined by the following equation:
This method has a drawback when some of the skills are found in many of the occupations. This may lead to a phenomenon called split loadings [27]. As a result, the correlation of such skills with multiple factors becomes very low. So it becomes hard to put such a skill into a specific factor group. These shortcomings can be overcome by Non-negative Matrix Factorization (NMF). So we deployed it and then compared the results with the FA model.
Non-negative matrix factorization (NMF)
By using NMF, sparse matrix V can be written as a multiplication of the two denser matrices W and H as given below:
All these three matrices have no negative elements which makes them easy to handle and that is one of the advantages of NMF over FA. NMF can handle polysemy which is the issue of a single word having multiple meanings [28].
Here V is row vectors matrix which contains the input data, W represents the transformed data set and H represents the basis set which defines a linear combination of columns of W.
The main differences between NMF and FA are summarized in Table 2.
Extensive change analysis
The study of changes across occupations is referred to as extensive margin analysis, and can only be fully understood by analyzing the distribution of demand for the different occupation classes. However, a priori definitions of the combinations of skills and activities which constitute specific jobs can bias our analyses [6]. Instead, we take an empirical approach to analyzing the occupational changes, where the definition of specific occupations are extracted using observed patterns and distributions. Data for the targeted job markets were gathered for the period between 2015 and 2018. For the same job title in the standardized O*NET database, there will be multiple job postings from the web advertisements in totally different structure in regards to the title and description of the job. If we are about to simply count the jobs from the web, there will be a huge number of job titles and descriptions for the same one standardized job as described in the ONET. Hence, for data analysis, we applied Latent Semantic Indexing (LSI) that resolve some of the polysemy and synonymy issues. In LSI, we map documents and terms into a latent semantic space via a singular value decomposition SVD method. In addition, Latent Dirichlet Allocation (LDA) model is applied for further extensive analysis. These two models are further described in detail in the following subsections "Latent Semantic Indexing (LSI)", "Latent Dirichlet Allocation (LDA)".
Latent Semantic Indexing (LSI)
Existing machine learning techniques for text classification usually require hand-labeled training data to effectively classify new sets of data. As such, the amount of available training data is often insufficient, which negatively affects model performance. Unsupervised methods like Latent Semantic Indexing (LSI) (Dumais et al. [29]) can help to overcome this problem by extracting semantic relationships present in unlabeled text corpora. This semantic space is termed as the latent space and the relationship between words and documents can be better elucidated in this space [30].
To achieve the above, we made use of the Gensim python library [31], which automatically extracts semantic topics from the unstructured text. Gensim supports two different topic modeling algorithms, Latent Semantic Analysis (LSA) and Latent Dirichlet Allocation (LDA), both of which are unsupervised algorithms which require no manual labeling of training data. The algorithms search for co-occurrence patterns of the words within a corpus which can be used to decompose the documents into their underlying semantic representations or topics. Using this approach, unstructured documents collected from the Web can be compared with occupations listed in O*NET by comparing the corresponding topics. LSI also deals with the issues of synonymy, in which multiple words share the same meaning, and polysemy, where individual words may have more than one meaning.
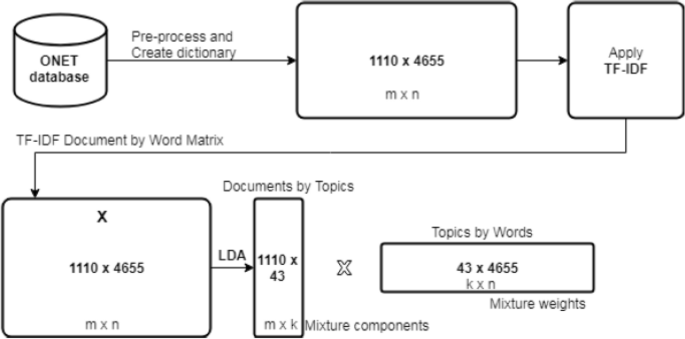
We transformed O*NET occupation descriptions into vector space where each element in the vector represents a word. The textual data is then represented as a word-document matrix X (n × m). n represents the size of the terms, and m represents O*NET occupation descriptions size. Any given element \(x_{t,d}\) gives us the number of occurrences of the term t in the document d. We then assigned weights to the terms with the help of Term Frequency-Inverse Document Frequency (TF-IDF) formula weighting scheme. This helps in moderating the weights of frequently occurring terms and increasing the weights of rare terms [32], but we did not use it in the pre-processing steps because it sets the TF-IDF value to zero if the word of interest appears in all documents. After this, we performed Singular Value Decomposition (SVD). The SVD of matrix X is given by:
Here L represents the left singular value vector, R represents the right singular value vector and S represents the diagonal matrix of singular values which are ordered by magnitude. If the dimensions of matrix X is (m × n) then respective dimensions for L, S, and R will be (m × k), (k × k) and (k × n) respectively. Due to this order, the matrices can be simplified by setting the smallest optimal value of k for the matrix S. We then set the value of k as 300 according to already existing literature [31, 33]. So to summarize, in our case, after applying TDF-IF we got our matrix “X” with dimensions (1110 × 4655). Then when we applied LSI, we got matrices L (Documents by topics), S (Singular Values) and R (Topics by words) with dimensions (1110 × 300), (300 × 300) and (300 × 4655) respectively. Moving forward, we identified the similarities. We projected each job posting to a query vector \(Q_{k}\). The weights for a single job posting are the entries of the query vector \(Q_{k}\), where \(Q_{k}\) is given explicitly by the following displayed formula. As described shortly, we will then normalize these weights across all p job postings and finally sum the normalized weights across the p job postings to obtain weights corresponding to each occupation. The semantic space is of k dimensions. The following formula was used for this purpose:
Here \(S^{-1}\) represents the inverse of matrix S defined earlier, \(L^T\) represents the transpose of the matrix L, and Q represents the term vector. We performed numerous similarity tests but Cosine similarity turned out to be the most appropriate in our case. The Cosine similarity for two vectors \(u_{a}\) and \(u_{b}\) is given by:
where \(u_{a}\) and \(u_{b}\) are n-dimensional vectors over the term set \(U = u_{1},...,u_{n}\).
For normalization we used z-score normalization given below:
where \(\mu\) represents the mean of feature x and \(\sigma\) represents the standard deviation of feature x.
In the end z-scores are fed into the p vectors whose values correspond to each job postings. Then, p vectors are summed together to form a single vector W. Each element of W is a demand weight for each occupation in the O*NET database. Later, all these weights were being used to perform intensive and extensive analysis. The results of the analyses are discussed in the section "Results". LSI turned out to be a very robust model as it can be applied to different job markets. Further, LSI can be applied irrespective of geographical location and still produce accurate and reliable results.
Latent Dirichlet Allocation (LDA)
Latent Dirichlet Allocation (LDA) is a generative probabilistic model for collections of discrete data, such as text corpora [34]. Schematic diagram of the applied LDA methodology is given in Fig. 1. LDA uses Dirichlet distribution [35] which supposes that all occupations cover only a small set of topics, and the topics are represented with a small set of words. Implementing LDA is usually done with two approaches: Using an Expectation Maximization (EM)-like procedure called variational inference and Using a randomized algorithm called Gibbs sampling. In our case, we want to discover the topics (combination of the O*NET jobs) looking at only words that are occurring in the web jobs descriptions. LDA observes all the words in a given document, and hence tells us which topics are present in it. Thus this generates a topic distribution. Figure 2 depicts the LDA Model where:
-
Nodes are random variables,
-
Edges denote possible dependence,
-
Observed variables are shaded,
-
Plates denote replicated structure,
-
M denotes the number of documents,
-
N is the number of words in a document,
-
\(\alpha\) is the parameter of the Dirichlet prior on the per-document topic distributions,
-
\(\beta\) is the parameter of the Dirichlet prior on the per-topic word distribution,
-
\(\theta _{m}\) is the topic distribution for document m,
-
\(\varphi _{k}\) is the word distribution for topic k,
-
\(z_{mn}\) is the topic for the n-th word in a document m,
-
\(w_{mn}\) is the observed word in a document m
Schematic diagram of the applied Latent Dirichlet Allocation (LDA) model
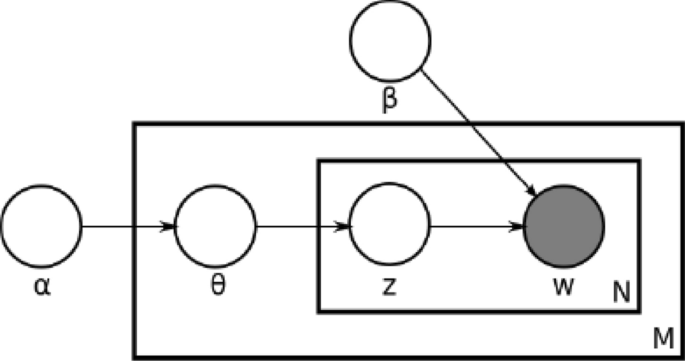
Latent Dirichlet Allocation (LDA) model
Adjusting the hyperparameters \(\alpha\) and \(\beta\) controls the learning of the model. Setting \(\alpha\) to a higher value will make every document a mixture of many topics. On the contrary, setting \(\alpha\) to lower value will mean that the document is represented by only a few topics. In our case, we want \(\alpha\) to be lower value because our occupations are represented with only a few topics where a topic is simply a probability distribution over words. Subsequent, modifying \(\beta\) to a higher value will mean that each topic is a mixture of many words. Conversely, changing \(\beta\) to lower value will mean that the topic is a mixture of just a few words. We want topics to be as distinct as possible, although there will be words appearing in several topics due to overlapping skills in a different type of jobs hence, \(\beta\) is also set to a lower value. The lower values of hyperparameters \(\alpha\) and \(\beta\) will result in more decisive topic associations [36]. The model‘s only observed variable is words, while the other unobserved (latent) variable is topics which will be inferred from the observed variable words.
The joint distribution of a topic mixture \(\theta\), a set of N topics z, and a set of N words, w is given by:
here \(p(z_n|\theta )\) represents \(\theta _i\) for a unique value of i such that it satisfies \(z_n^i=1\). Also the parameters \(\alpha\) and \(\beta\) are given. The marginal distribution of a document is obtained by integrating over \(\theta\) and summing over z. It can be described as follows:
Next, we need to choose the value of k, which represents the number of topics, and which can significantly impact the final outputs of the model. Unfortunately, the choice of k is somewhat subjective and most approaches tend to be iterative [37]. In this paper, we used two techniques to decide the value of k:
-
1.
The number of topics can be approximately given by \((m \times n) / t\). Here t is the number of entries in D which are non-zero [38]. D in the formula represents the matrix of size m by n formed by a collection of documents. We plugged the values from our data into the formula and get the value of k to be \((1110 \times 4655) / 121472 \approx 43\).
-
2.
The other technique we used is the Coherence score. For a topic to be more intuitive, its coherence score should be higher. Coherence is given by the Formula 11 which was given by Mimno et al. [39].
$$\begin{aligned} C (t; V^{(t)}) = \sum _{m=2}^{M} \sum _{l=1}^{m-2} \log \dfrac{D (v_{m}^{(t)}, v_{l}^{(t)}) + 1}{D (v_{l}^{(t)})} \end{aligned}$$(11)Here D(v) denotes the document frequency of word type v and D(v, w) denotes the co-document frequency of word types v and w. Also, \(V(t) = (v_{1}(t),v_{2}(t),.....v_{M}(t))\) is the list of M most probable words in topic t.

Coherence vs number of topics
We tried to find a perfect balance between overfitting and underfitting. As can be seen in Fig. 3, the highest coherence score was 43 topics. This is the same as we got from approximation in our first technique. So we set the value k to be 43.
We then validated the number of topics suggested by the coherence measure with the help of visualization. To facilitate visualization, we deployed pyLDAvis library. Figure 4 shows that the topics are distinguished as one can easily identify that topic 1 is about oil & gas (distinctive words—process, research, develop, etc.). The bigger the size of the circle, the more that topic is present in the data. We can also get significant information about the estimated term frequency within a topic that is selected (red color) when compared to the overall frequency of that particular term (blue color).

Topic 1—oil & gas
In the next step, we calculated the similarity weights. For this purpose, Hellinger distance [40] method was used. If there ate two probability distributions given by \(P = (p_1,...p_k)\) and \(Q = (q_1,...q_k)\), Hellinger distance can be calculated using the Formula 12.
The higher the value of Hellinger measure, the lower is the similarity between two given probabilities. In order to make the given equation consistent with the cosine similarity, we changed the formula as follows:
As a final step, we performed the intensive and extensive analysis by using the generated weights from the LDA model. It is important to mention that neither LSI nor LDA necessarily yields an accurate ground truth, however, LSI proved to be more robust than LDA which is in accordance to the findings of other researchers as well [41]. The results of the analyses can be seen in detail in section "Results".
Job analysis framework tool
Since this study is limited only to oil & gas sector, we developed a job analysis system that anybody can utilize for further analysis. Job Analysis Framework is designed to evaluate job data for extensive and intensive changes. The ultimate goal of the framework is to enable users to analyze their data for any job market or industrial sector with only one click and without any programming knowledge.
For these purposes, https://www.kudsom.org/ website is developed which employs all developed models in Python programming language. Every website contains two main parts for development: front-end, and back-end. In simple words, the front-end is what users see on the web page when they open the website. On the other hand, the back-end is what regular user does not see. Behind the scenes, back-end developers are involved with databases, servers, and application. The following steps briefly explain applied tools to build the job analysis framework website:
-
1.
Flask—back-end framework
-
2.
Bootstrap—front-end framework
-
3.
PythonAnywhere—web hosting service
1. FlaskFootnote 2 is a web framework which allows website development using Python programming language. This allows users of the website to easily upload their data for the jobs, and run a comprehensive analysis with only one click.
2. As important as the back-end, is the front-end development. It is very important to provide the user with a friendly interface website. To allow this, BootstrapFootnote 3 open-source toolkit is deployed.
3. Finally, to deploy developed site on the server, we used PythonAnywhereFootnote 4 free web hosting service.
Results
After deploying the LDA and LSI models on our dataset, we came up with a matrix of size \(1110 \times 2\). This matrix contains the title of the occupation from the O*NET database and the corresponding weights. Then we sorted the occupations in descending order depending upon the weights. We updated the complete data on our job analysis website provided earlier. In this paper, for illustrative purposes, we are providing the top 10 occupations only in the form of tables in the results section.
LSI model results—job market data
The top 10 occupations with the highest weights in oil & gas industry of GCC and USA are being displayed in Table 3.
We can see that the occupation ‘Mechanical Engineers’ has a higher weighting than ‘Civil Engineers’. This shows that more Mechanical Engineer than Civil Engineer positions are available in the GCC oil and gas industry, which results in the relevant skills being in greater demand. As might be expected, both the oil & gas industries in the USA and the GCC have some overlapping jobs that are in high demand like ‘Mechanical Engineer’ and ‘Electrical Engineer’. However, it is interesting to notice that the proposed model also exposed notable differences between the two job markets, where engineers tend to be in greater demand in the GCC, while Managerial and Human Resources (HR) positions are relatively more prevalent in the USA. A possible explanation for this was presented in [42], which postulated that HR is seen as a ‘cost’ to the employer in GCC countries and not a valued resource to be invested in.
We further observe that the LSI model which we generated came up with very relevant top occupations from the oil & gas industry.
LDA oil & gas job market data
Table 4 shows the top 10 occupations in the GCC (left) and USA (right) oil & gas industry sorted by generated weights where the highest position corresponds to the greatest demand. For example, we can see that the occupation ‘Intelligence Analysts’ has a higher demand than for example ‘Anthropologists’ from which it can be inferred that more Intelligence Analysts than Anthropologists positions are wanted in the GCC oil & gas industry, and hence that the corresponding skills would be in greater demand. However, what is unique about LDA is that it bring some interesting results that LSI model did not find, for example, positions like ‘GeoScientists’ are in the top demand for GCC oil & gas industry. In addition, it is encouraging to see demanding positions for ‘Sustainability’ in oil & gas Sector. There are also some occupations that on the first look does not seem to be related to oil & gas industry like ‘Curators’ and ‘Statisticians’ but indeed if we look at the description of these jobs, they have related words with some of the description jobs from oil & gas industry. As LDA is a probabilistic model determining which topics are present in any given document by observing all the words this leads it to conclusions that these occupations are part of oil & gas industry which can be considered as a shortcoming of the LDA model. For example, in the ‘Curators’ occupation we find sentences like “Plan and organize the acquisition, storage, and exhibition of collections and related materials, including the selection of exhibition themes and designs, and develop or install exhibit materials” or “Plan and conduct special research projects in the area of interest or expertise. Confer with the board of directors to formulate and interpret policies, to determine budget requirements, and to plan overall operations.” while in the ‘Statisticians’ description we can find related sentences: “Develop or apply mathematical or statistical theory and methods to collect, organize, interpret, and summarize numerical data to provide usable information.” or “Adapt statistical methods to solve specific problems in many fields, such as economics, biology, and engineering.”
For the USA and GCC oil & gas data, both regions have some overlapping jobs that are in high demand like ‘Chief Sustainability Officers’. In LSI results for USA oil & gas data, we had a trend for Managers and HR positions. LDA shows this trend even more explicit where the majority of the top 10 demanded positions are related with Managers. Thus, we can conclude that USA and GCC job markets are quite different within the same oil & gas industry.
LSI and LDA model results—academic data
In this paper, to get a complete picture of the changes in the job market, we not only analyzed the demand side but also analyzed the supply side to provide a complete picture. For doing the supply-side analysis, we collected academic data from various top-rated educational institutes in the UAE for oil & gas related courses. We collected course syllabuses from these institutions. The top 10 occupations based on the supply-side data of the oil & gas industry are being shown in Table 5. The one at the top represents the occupation with the highest supply and vice versa.
As can be seen from Table 5, all the jobs located at the top are very closely related to oil & gas industry, but this should not be surprising that majority of job demands are associated to ‘teachers’. This can be attributed to the fact that in the corpus of collected academic data, there have been a high frequency of words like ‘course’, ‘research’ and ’students’.
When we observe the top oil & gas industry jobs from the supply side, we get an indication that the faculty in the UAE can provide appropriate general knowledge to the students, but for jobs like ‘Civil Engineers’ and ’Petroleum Engineers’, very specific and specialized knowledge is required. In order to better understand the mismatch between the supply side and the demand side, we exploited the heatmap visualizations "LSI and LDA weights visualization using". This will help us in finding out if the courses taught are imparting right skills into the students to make them ready for the job market.
For the oil & gas academic data, the LDA model also provided insightful results. Interestingly, in oil & gas academic data, we find more positions that are related to general knowledge from this industry, rather than specific occupations. Hence, this can be a possible indicator that faculty related to oil & gas industry needs to focus more at teaching specific high skill knowledge like for example we see in demand ‘Petroleum Engineers’. Although we see some specific knowledge like for example in academic data we have ‘Geospatial Information Scientists and Technologists’ which can correspond to demand position ‘Geoscientists’.
LSI and LDA results validation
We used SurveyMonkey platform to circulate a questionnaire which asked the participants to select either “Relevant” or “Irrelevant” for each of the job titles in oil & gas industry based on data analysis of job titles. For example, for all job titles that are related to oil & gas industry, the participant will select “Relevant”, otherwise, if the job title is not relevant to the industry, the user will select “Irrelevant”.
As can be inferred from the Fig. 5 LSI and LDA models provided very relevant top 10 occupations in the oil & gas industry.
It was observed that the LSI model was providing better results when compared to the LDA model. There were a significant number of occupations for which 100% of the participants agreed that the given occupation is relevant to the oil & gas industry. To see all the results of the survey, follow this link: https://www.surveymonkey.com/results/SM-FVTF6PJXL/.

Results for LSI (left) and LDA (right) models for the oil & gas industry
LSI and LDA weights visualization using Heatmaps
We visualized the job demands with the help of heatmaps to make the results more comprehensible. But it’s difficult for humans to comprehend more than 3-d graphs, and hence it becomes difficult to intuitively visualize our high-dimensional matrix. So we deployed Principal Components Analysis (PCA) on the occupations-skills matrix. PCA simply applies linear transformations and finds out the maximum variance direction in multi-dimensional data. These directions are referred to as principal components. Later on, when required, we can retrieve the original data with a very small loss in information. In order to make it simplified, we extracted only the first two components of the skills and occupations matrix. These components has been represented as the x and y axes in the graphs presented in this paper.
Then we estimated the contours from weights with the help of k-nearest neighbors (k-NN) algorithm [43]. After this, we overlayed these contours on the two-dimensional space generated by Principal Component Analysis described earlier.
The color coding legend can be seen in Fig. 6. Dark blue represents high demand while light green signifies low demand. All the intermediate demands are represented with intermediate shades between dark blue and light green. As you can see on the legend, only 6 occupation titles are being represented to make visibility clearer. Each of these occupations are from different weight groups. The corresponding representations are marked with shapes like square and circle as can be seen in the legend.
The six occupations which are being chosen are chosen randomly from the 6 different demand categories. Hence the results can be deemed reliable. As we aimed to present all the low demand and high demand occupation scenarios, there was a need of categorization because otherwise all the six chosen occupations might have turned out to be from one specific area (Low demand or high demand). We also randomly selected few occupations from very low demand to ensure that these jobs with very low demand are not from the oil & gas industry. For example, if we see “Petroleum engineers” in the low demand area, then we can get an idea that our model has something wrong with it.

Heatmaps scale based on weights
Heatmaps generated from the LSI weights
The heatmap for the GCC (left) and USA (right) oil & gas industry is shown in Fig. 7. As can be seen in the heatmaps, our heatmap visualizations are in alignment with the top 10 occupations which came out from the LSI model. There is a similarity between job market data of the US and GCC. This confirms our model is reliable no matter what geographical location it is applied on. As can be seen, heatmap 7 confirm that there appears to be a greater managerial and/or HR jobs for USA market in oil and gas companies, while demand for the same industry operating in the GCC region seems to be focused more on technical engineering jobs as expected.

LSI Heatmap for GCC (left) and USA (right) oil & gas
Figure 8 shows oil & gas industry demand (left) and supply (right) heatmaps for the GCC region. We can see that occupation ‘Petroleum Engineers’ has both high demand and supply; however, “teaching” occupations that have a high supply like ‘Environmental Science Teachers’, does not match the same intensity of demand on the job market. In addition, interdisciplinary jobs like ‘Sales Managers’ that have high demand in the job market, does not match the same supply which can indicate that interdisciplinary skills are lacking with students. One possible reason for this mismatch is the different use of terminology between academia and industry. For instance “course” and “students” are common in academia compared to industrial sector [15]. Other reason could be the mismatch between the faculty courses and the specific skills requirements of the job market.

LSI Heatmap for GCC oil & gas Demand (left) and Supply (right)
Heatmaps generated from the LDA weights
The LDA heatmaps also turn to be in agreement with our top 10 occupations findings using the LDA model. There is agreement between oil & gas job market data and academic data; or oil & gas industry with different geographical location. This confirms the LDA model is also robust no matter which geographical location it is implemented on.

LDA Heatmap for GCC (left) and USA (right) oil & gas
Figure 9 shows oil & gas industry heatmaps for GCC (left) and USA (right) regions. As expected, both regions USA and GCC for oil & gas industry have some overlapping jobs that are in high demand like ‘Water Resource Specialist’, ‘Cost Estimators’. LDA shows slightly higher demand in GCC for positions ‘GeoScientists’, Except ’Hydrologists and Geographers’, and ‘Fuel Cell Engineers’. In addition, it can be seen that there is an overall difference between two regions, which is in assent to the previous conclusion that USA and GCC job markets are considerably different within the same Oil and Gas industry.
Same conclusions can be made from Fig. 10 GCC Demand (left) and UAE Supply (right) oil & gas where it can be inferred that demand is covering many more occupations comparing to what is provided with supply. Since we cover only six occupations in heatmaps visualizations all occupations cannot be shown. However, one interesting occupation that heatmap discovered is ‘Marine Engineers’ which can be found in high demand but low supply weight. Once again, seems that interdisciplinary knowledge is lacking on the supply side.

LDA Heatmap for GCC demand (left) and UAE supply (right) oil & gas
Results of the factor analysis (FA) and non-negative matrix (NMF) factorization
After the extensive analysis, we applied the generated weights for analyzing the intensive margin changes. Negative values in Fig. 11 represent that average occupational requirements are lower for that skill factor in 2015 than in 2008. This figure was generated solely based on the O*NET database, that is why there are no any weights on it.
NMF model extracted six O*NET Factors or we can call them skill sets. Their description can be seen in Table 6. Those factors are comprehensively explained below:
-
1.
Management Performing Administrative Activities, Documenting Information, Processing Information, and similar skills are in decreasing because they are replaced by new technology. For example, to document and record information we do not need to hold a collection of physical documents records. Instead, we have electronic versions and store them in the cloud or some similar online platform.
-
2.
Quality Control Inspecting products, services, or processes to control quality and/or performance is similar like Equipment factor. However, here we focus more on software and end products rather than on machines itself. As expected, these skills are in more demand.
-
3.
Analytics This factor has a quite low standard deviation, so it is almost unchanged for these 7 years because even computers are great in dealing with numbers we still need mathematical skills for new algorithms and various kinds of optimization problems.
-
4.
Equipment Equipment skills are showing positive value which means that average occupational requirements are higher for this skill factor in 2015 than in 2008 which is normal due to the fact that now we have so many machines and automated processes which require humans to look after these.
-
5.
Manual We see that manual is most affected which is expected because these kinds of jobs consist of the routine manual tasks which can be easily automated and replaced with machines. Hence, manual skills’ importance within jobs has decreased over time.
-
6.
Cognitive This factor is showing negative value without weights and slightly negative with weights. This can be due to skills within it that can be shared with many other occupations.

NMF factors shifts between 2008 and 2015
As was anticipated, depending on the data from which weights are applied, these factors can prevail on a different scale of demand—from lower to higher or vice versa. An interesting example is the one from weights related to academia. From Fig. 12 it can be seen that both LSI (left) and LDA (right) weights caused factor ‘Analytics’ predominate from lower to a higher demand. Two more factors that changed demand, but this time from higher to lower are ‘Equipment’ and ‘Quality Control’. Acknowledging the data weights are from academia, this is not a surprise because these two factors are more related to the industry.

NMF GCC oil& gas courses LSI (left) and LDA (right)
FA model extracted five O*NET factors as shown in Table 7.
FA model results for five O*NET Factors as described below:
-
1.
Supervision This includes skills related to scheduling, work coordination, guiding, etc. In past years, technology has enabled workers to conduct their work without supervisory intervention. For instance, online resources, such as email exchanges and e-meetings, enable people to collaborate without requesting resources or scheduling meetings through supervisors. An even better example is a customer that now summon Uber car with one click on the application so no need to interact with a human dispatcher who in this example will be the supervisor.
-
2.
Mathematics This factor was also extracted with NMF technique, so this again confirms the consistency of these two techniques. We get almost the same results with subtle standard deviation for mathematical skills which shows that these skills were almost unchanged in demand comparing 2008 and 2015 year.
-
3.
Perception The importance of its skills are also decreased over time. This is because nowadays computers comprehend speech in ways they could never do before. Also, computer vision capabilities have advanced rapidly because of sensors so now computers can recognize various type of objects, comprehend writing, identify production defects on assembly lines, etc.
-
4.
Equipment This factor was also extracted with NMF technique so this confirms the consistency of these two techniques. FA here shows an even stronger demand for these skills than NMF model. Interestingly, weights from the LSI model are showing even more importance to Equipment skill sets.
-
5.
Problem Solving Obviously, these are the skills where a computer is still underperforming compared to the human brain. However, with fast-improving on the machine learning field, especially deep learning area, these are also threatened in the future to be replaced by the machine.
When the weights from LSI and LDA models were introduced to these five factors produced by FA model, there were no big changes in terms of changing the sides of demand, only the intensity of demand was strengthened. Nonetheless, in GCC and USA oil & gas industry there seems to be a slight discrepancy between LSI and LDA model as Figs. 13, 14, suggest. Videlicet, for both USA and GCC oil & gas industry, LDA model shows slightly more demand for Mathematical skill sets in 2015 compared to the 2008 year; while the LSI model shows imperceptibly less demand for the same skill-sets. The aforementioned disagreement can be neglected as the changes in standard deviations for this skill-sets are very small.

FA GCC (left) and USA (right) oil & gas LSI

FA GCC (left) and USA (right) oil & gas LDA
Discussion and evaluation
The study aims to utilize data science techniques to come up with useful insights into the changes happening in the demand for certain jobs and skills in the oil & gas industry. To get a wholesome analysis, we did extensive as well as intensive analysis of the changes in jobs fro two geographical locations, USA and the GCC. There is extensive literature already existing on this topic but we are filling the gap of measuring the extent or magnitude of the changes in demand and supply of oil & gas industry jobs. The most important findings of this research are being discussed further:
Intensive Analysis The NMF model discovered that Quality Control Analysis factor is also in higher demand. By analyzing the skills from this factor, we see the importance of skills such as troubleshooting, programming, etc. One more factor that is in higher demand and which is identified by the FA model is Problem Solving. Indeed, this is also expected since today’s problems are not routine (the routine problems are easily solved with machines) but rather need critical thinking to be solved. Factors whose demand is lower in the year 2015 in comparison to the year 2008 are manual, cognitive, management, perception, and supervision. Due to continuous improvements in the capability of machines, they nowadays can understand speech, writing and can distinguish between different objects. Hence we can expect the factors like manual, perception and cognitive to get lower in demand over the years which is what our model tells us. But it comes as a surprise to see factors like supervision and management getting lower in terms of demand in oil & gas job market. When we examine the skills related to these two factors, we will also notice that they have been replaced with new technologies over time, as a result of which, the demand of these skills has been getting lower. A good example of the management skill “document and record information” we do not need any more to hold a collection of physical documents records. Instead, we have electronic versions and store them in the cloud or some similar online platform. Example for supervision factor can be a customer that now summon Uber car with one click on the application so no need to interact with a human dispatcher who in this example will be the supervisor. Nevertheless, one interesting skill where computers miserably fail and yet humans do it with ease is common sense.
One can easily observe from our findings, that in the oil & gas industry, the skills that are disappearing from demand in the job market are mostly those where machines can replace humans as a better alternative. But not only routine and manual skills are getting their demand lowered over time, few cognitive skills like management and supervision are also seeing a significant decline in their demand. We can also see examples where computers are able to generate artistic images [44] or music [45]. In addition, by applying weights from extensive analysis prior to factor extraction, we discovered that in academia, Mathematical and Analytical skill-sets are in higher demand in the year 2018 in comparison to the year 2008. The conclusion is that we should not ‘fight’ against the machines, rather we should cooperate, which as a result will have the best combination of skills in which performance humans and machines are the best. Furthermore, this will let humans focus more on the skills which computers still couldn’t perform well e.g. critical thinking and social skills like motivation and leadership. In particular, firms have become increasingly more likely to demand Social skills [46].
Extensive Analysis The extensive analysis for the GCC and USA oil & gas industry showed us that both regions have some overlapping jobs that are in high demand like ‘Petroleum Engineers’, ‘Mechanical Engineers’, ‘Civil Engineers’. However, more interestingly the results expose the different type of job markets between USA and GCC, where GCC is in more demand for engineers, while in the USA we can find high demand jobs for Manager and Human Resources (HR) positions. The question for future research is will the UAE job market for oil & gas industry lean more towards similar jobs as we can find now in the same industry in the USA. For the academic data of the oil & gas sector based on the observed results, the conclusion can be that the faculty is not providing the students with the specific skills which are required to perform a job in the oil & gas industry. They are imparting only some adequate general knowledge into the students. This can be compensated by additional training series organized by companies related to the industry. Through these series, by educating the students, companies will provide them with the required skills to work in the fast-developing oil & gas industry. In addition, students will need to explore beyond their field, to find interdisciplinary jobs that can be related to their field of expertise, so they can acquire new skills in order to ease the transfer into new interdisciplinary jobs that require the fusion of their old and newly acquired skills.
Recommendations based on findings in this article (In the context of the UAE):
-
1.
The Job Analysis Framework Tool provided by us can be very helpful to policy decision-makers. Through this tool, they will be able to find the mismatch which exists between the skills which are imparted by educational institutions into the students and the skills which are required to perform specific jobs in the oil & gas industry. This may lead a way for the policymakers to enforce collaborations between several educational institutions with the required infrastructure and the companies in oil & gas sector. As a result of which, the educational institutions will be walking hand in hand with the industry to design the course curriculum and projects that can have a real impact on the industry. An example of such collaboration can be a University and its founded projects with private sectors. Aforementioned will help students to perform applied research and by doing so gain the experience needed in the real job market. Further, private sectors can suggest universities to add practice and help educational entities to design adequate courses to match skills sets with those that are in-demand at the job market. Hence when the students will graduate, they will have the required skills to immediately take up a job in one of those companies. This scenario would cause a win-win situation for both companies and educational institutions.
-
2.
Due to the saturation of the public sector, UAE nationals should increase their involvement in the private sector. UAE is among the leading countries when it comes to automation of public sector processes. This is a major factor in the reduction in the number of jobs in the UAE public sector. Hence acquiring of right skills and proper guidance and support becomes very important. Our analysis tool provides intrinsic analysis which will help the UAE nationals to ultimately know the required skills and attain them. This will make life easy for the students in order to get a job in the private sector. Furthermore, policymakers should highly recommend educational systems to study more about problems that are highly related to the UAE like water desalinization, increasing demand for energy, food production, etc. which should inspire Emiratis to start their own private companies that should tackle these or similar issues and help increase the creative solutions developed inside the UAE.
-
3.
When we have a look at our Extrinsic analysis, we find out that there has been an increase in the importance of certain occupations that are interdisciplinary in nature. Thus, Interdisciplinary knowledge, entrepreneurship, and innovation must be promoted in the students and the youth. This will ultimately lead to the flourishing of the startup ecosystem and new companies will be born.
Although in this article we only discussed about oil & gas industry in GCC and USA, it should be noted that the job analysis website https://www.kudsom.org/ can serve as an open resource for further research. It can be used for validating and verifying the results for any industry in any geographical location. Finally, the main objective of the research is attained, and that is to provide a comprehensive data analytics method to enhance the process of studying the actual market behavior and future needs based on real data acquired.
Conclusion
While the displacement of manual labor for repetitive and low skilled jobs has been ongoing for some time, the automation of high skilled, knowledge intensive tasks is a recent trend, and has profoundly affected almost all sectors of the oil & gas industry. Understanding and predicting the future impact of these changes is vital if appropriate actions are to be taken and effective policies formulated in response to these trends. Of equal importance is the need to create public awareness about the extent to which automation and other disruptive technologies will affect existing occupations in the near future. This should help to mitigate the impact on society and allow individuals to make informed decisions about their career paths.
The factorization techniques presented in this paper can be used to study the changes in demand for skills over specific industries and market. As a demonstration of this, the use of FA and NMF were demonstrated using occupational data from the years 2008 and 2015, and later 2008 and 2018. These valuable findings confirmed the concerns that automation is decreasing the certain skills demand. On the other hand, we also identified the new emerging skills that are required to strengthen the need for collaboration between minds and machines. LSI and LDA models for extrinsic analysis also proved to be incredibly useful for analyzing changes in job demands. Not only this analysis provided summarized jobs ordered by demand in a standardized view, but it also helps identify the differences between UAE and USA markets job markets. Furthermore, it helped to get insights into differences between skills that academia is equipping students, and skills that industry is requiring on the field.
Nevertheless, the analysis and decision making with regards to the HR industry to predict needed skills for the future of jobs shall be accompanied by an analytical tool. Therefore, a state of art approach has been developed and implemented in this study to further support decision-makers to make informed decisions by leveraging the use of data available in the job market.
It can be concluded that in the oil & gas industry, there are skills required which can not be completely replaced by machines but some of the skills can be replaced. If humans compete against machines in the skills where machines can perform better, then we would face the issue of under productivity. Hence humans should learn to work along with the machines and complement each other to get maximum benefits. In the era of new invasive emerging technologies, such as AI and ML, the future of work will be very much controlled by how we humans develop a symbiotic relationship with these technologies.
Availability of data and materials
The datasets generated and/or analysed during the current study are available in the following GitHub link: https://github.com/ArminMne/JobAnalysisFramework
Notes
Flask: http://flask.pocoo.org/.
Bootstrap: https://getbootstrap.com/.
PythonAnywhere: https://www.pythonanywhere.com/.
References
Rossetti MD, Felder RA, Kumar A. Simulation of robotic courier deliveries in hospital distribution services. Health Care Manag Sci. 2000;3(3):201–13.
Halal W, Kolber J, Davies O, Global T. Forecasts of AI and future jobs in 2030: muddling through likely, with two alternative scenarios. J Future Stud. 2017;21(2):83–96.
Moravec H. Mind children: the future of robot and human intelligence. Cambridge: Harvard University Press; 1988.
Brynjolfsson E, McAfee A. Race against the machine: how the digital revolution is accelerating innovation, driving productivity, and irreversibly transforming employment and the economy. Brynjolfsson and McAfee; 2012.
Brynjolfsson E, McAfee A. The second machine age: work, progress, and prosperity in a time of brilliant technologies. New York: WW Norton & Company; 2014.
MacCrory F, Westerman G, Alhammadi Y, Brynjolfsson E. Racing with and against the machine: changes in occupational skill composition in an era of rapid technological advance (2014)
Illéssy M, Makó C. Automation and creativity in work: Which jobs are at risk of automation? Intersections. East Eur J Soc Polit. 2020;6(2).
Kowalczyk R. Fuzzy e-negotiation agents. Soft Comput. 2002;6(5):337–47.
Broadbent E, Stafford R, MacDonald B. Acceptance of healthcare robots for the older population: review and future directions. Int J Soc Robot. 2009;1(4):319.
Alekseeva L, Azar J, Gine M, Samila S, Taska B. The demand for AI skills in the labor market. Labour Econ. 2021;71:102002.
Lee C-S, Wang M-H, Wu M-J, Nakagawa Y, Tsuji H, Yamazaki Y, Hirota K. Soft-computing-based emotional expression mechanism for game of computer go. Soft Comput. 2013;17(7):1263–82.
Karakatsanis I, AlKhader W, MacCrory F, Alibasic A, Omar MA, Aung Z, Woon WL. Data mining approach to monitoring the requirements of the job market: a case study. Inf Syst. 2017;65:1–6.
Woon, W.L., Aung, Z., AlKhader, W., Svetinovic, D., Omar, M.A.: Changes in occupational skills-a case study using non-negative matrix factorization. In: International Conference on Neural Information Processing, pp. 627–634. Springer (2015)
Booz M. These 3 industries have the highest talent turnover rates. LinkedIn Talent Blog. Business LinkedIn. 2018.
Alibasic A, Simsekler MCE, Kurfess T, Woon WL, Omar MA. Utilizing data science techniques to analyze skill and demand changes in healthcare occupations: case study on USA and UAE healthcare sector. Soft Comput. 2020;24(7):4959–76.
Jensen PB, Jensen LJ, Brunak S. Mining electronic health records: towards better research applications and clinical care. Nat Rev Genet. 2012;13(6):395.
Li J, Fong S, Zhuang Y, Khoury R. Hierarchical classification in text mining for sentiment analysis of online news. Soft Comput. 2016;20(9):3411–20.
Rajpathak D, De S. A data-and ontology-driven text mining-based construction of reliability model to analyze and predict component failures. Knowl Inf Syst. 2016;46(1):87–113.
Brüning, N., Mangeol, P.: What skills do employers seek in graduates?: Using online job posting data to support policy and practice in higher education (2020)
Olson DL, Delen D. Advanced data mining techniques. Berlin: Springer; 2008.
Han J, Pei J, Kamber M. Data mining: concepts and techniques. Amsterdam: Elsevier; 2011.
Sarkar D. Processing and understanding text. In: Text Analytics with Python, Springer. 2016, p. 107–165.
Denny MJ, Spirling A. Text preprocessing for unsupervised learning: why it matters, when it misleads, and what to do about it. Polit Anal. 2018;26(2):168–89.
Horst P. Factor analysis of data matrices. New York: Holt, Rinehart and Winston; 1965.
Lawley DN, Maxwell AE. Factor analysis as a statistical method, vol. 18. Hoboken: Wiley Online Library; 1971.
Jolliffe I. Principal component analysis. Encyclopedia of statistics in behavioral science (2005)
Yong AG, Pearce S. A beginner’s guide to factor analysis: focusing on exploratory factor analysis. Tutor Quant Methods Psychol. 2013;9(2):79–94.
Lee DD, Seung HS. Learning the parts of objects by non-negative matrix factorization. Nature. 1999;401(6755):788.
Dumais ST, Furnas GW, Landauer TK, Deerwester S, Harshman R: Using latent semantic analysis to improve access to textual information. In: Proceedings of the SIGCHI Conference on Human Factors in Computing Systems, pp. 281–285 (1988). ACM
Deerwester S, Dumais ST, Furnas GW, Landauer TK, Harshman R. Indexing by latent semantic analysis. J Am Soc Inf Sci. 1990;41(6):391.
Rehurek R, Sojka P. Software framework for topic modelling with large corpora. In: Proceedings of the LREC 2010 Workshop on New Challenges for NLP Frameworks, pp. 45–50. ELRA, Valletta, Malta. 2010.
Manning CD, Raghavan P, Schütze H, et al. Introduction to information retrieval, vol. 1. Cambridge: Cambridge University Press Cambridge; 2008.
Bradford, R.B.: An empirical study of required dimensionality for large-scale latent semantic indexing applications. In: Proceedings of the 17th ACM Conference on Information and Knowledge Management, pp. 153–162 (2008). ACM.
Blei DM, Ng AY, Jordan MI. Latent Dirichlet Allocation. J Mach Learn Res. 2003;3:993–1022.
Ma Z, Lai Y, Xie J, Meng D, Kleijn WB, Guo J, Yu J. Dirichlet process mixture of generalized inverted dirichlet distributions for positive vector data with extended variational inference. IEEE Trans Neural Netw Learn Syst. 2021. https://doi.org/10.1109/TNNLS.2021.3072209.
Gregor H. Parameter estimation for text analysis. Technical report (2005)
Zhao W, Chen JJ, Perkins R, Liu Z, Ge W, Ding Y, Zou W. A heuristic approach to determine an appropriate number of topics in topic modeling. BMC Bioinform. 2015;16:8.
Can F, Ozkarahan EA. Concepts and effectiveness of the cover-coefficient-based clustering methodology for text databases. ACM Trans Database Systems (TODS). 1990;15(4):483–517.
Mimno D, Wallach HM, Talley E, Leenders M, McCallum A. Optimizing semantic coherence in topic models. In: Proceedings of the Conference on Empirical Methods in Natural Language Processing, pp. 262–272 (2011). Association for Computational Linguistics.
Hellinger E. Neue begründung der theorie quadratischer formen von unendlichvielen veränderlichen. Journal für die reine und angewandte Mathematik. 1909;136:210–71.
Anaya LH. Comparing Latent Dirichlet Allocation and latent semantic analysis as classifiers. Ohio: ERIC; 2011.
Harry W. Employment creation and localization: the crucial human resource issues for the gcc. Int J Hum Resour Manag. 2007;18(1):132–46.
Larose DT. k-nearest neighbor algorithm. Discovering knowledge in data: An introduction to data mining, 90–106 (2005)
Gatys LA, Ecker AS, Bethge M. A neural algorithm of artistic style. arXiv preprint arXiv:1508.06576; 2015.
Gautam S, Soni S. Artificial intelligence techniques for music composition. Int J Sci Res Comput Sci Eng Inform Technol. 2018;3(3):385–9.
Hansen S, Ramdas T, Sadun R, Fuller J. The demand for executive skills. National Bureau of Economic Research: Technical report; 2021.
Acknowledgements
Not applicable.
Funding
This publication is based upon work supported by the Khalifa University of Science and Technology under Award No. RCII-2019-002, Center for Digital Supply Chain and Operations Management.
Author information
Authors and Affiliations
Contributions
AA: Conceptualization, Methodology, Software, Data curation, Writing- Original draft preparation. HU: Writing- Reviewing and Editing. MCES: Writing- Reviewing and Editing TK: Writing- Reviewing and Editing. WLW: Writing- Reviewing and Editing. MAO: Writing- Reviewing and Editing. All authors read and approved the final manuscript.
Corresponding author
Ethics declarations
Ethics approval and consent to participate
This article does not contain any studies with human participants or animals performed by any of the authors.
Competing interests
The authors declare that they have no competing interests.
Additional information
Publisher's Note
Springer Nature remains neutral with regard to jurisdictional claims in published maps and institutional affiliations.
Rights and permissions
Open Access This article is licensed under a Creative Commons Attribution 4.0 International License, which permits use, sharing, adaptation, distribution and reproduction in any medium or format, as long as you give appropriate credit to the original author(s) and the source, provide a link to the Creative Commons licence, and indicate if changes were made. The images or other third party material in this article are included in the article's Creative Commons licence, unless indicated otherwise in a credit line to the material. If material is not included in the article's Creative Commons licence and your intended use is not permitted by statutory regulation or exceeds the permitted use, you will need to obtain permission directly from the copyright holder. To view a copy of this licence, visit http://creativecommons.org/licenses/by/4.0/.
About this article

Cite this article
Alibasic, A., Upadhyay, H., Simsekler, M.C.E. et al. Evaluation of the trends in jobs and skill-sets using data analytics: a case study. J Big Data 9, 32 (2022). https://doi.org/10.1186/s40537-022-00576-5
Received:
Accepted:
Published:
DOI: https://doi.org/10.1186/s40537-022-00576-5