- Research
- Open access
- Published:
Reality mining and predictive analytics for building smart applications
Journal of Big Data volume 6, Article number: 66 (2019)
Abstract
Background
Mobile phone and sensors have become very useful to understand and analyze human lifestyle because of the huge amount of data they can collect every second. This triggered the idea of combining benefits and advantages of reality mining, machine learning and big data predictive analytics tools, applied to smartphones/sensors real time. The main goal of our study is to build a system that interacts with mobile phones and wearable healthcare sensors to predict patterns.
Methods
Wearable healthcare sensors (heart rate sensor, temperature sensor and activity sensor) and mobile phone are used for gathering real time data. All sensors are managed using IoT systems; we used Arduino for collecting data from health sensors and Raspberry Pi 3 for programming and processing. Kmeans clustering algorithm is used for patterns prediction and predicted clusters (partitions) are transmitted to the user in his front-end interface in the mobile application. Real world data and clustering validation statistics (Elbow method and Silhouette method) are used to validate the proposed system and assess its performance and effectiveness. All data management and processing tasks are conducted over Apache Spark Databricks.
Results
This system relies on real time gathered data and can be applied to any prediction case making use of sensors and mobile generated data. As a proof of concept, we worked on predicting miscarriages to help pregnant women make quick decisions in case of miscarriage or probable miscarriage by creating a real time system prediction of miscarriage using wearable healthcare sensors, mobile tools, data mining algorithms and big data technologies. 9 risk factors contribute vastly in prediction, the Elbow method asserts that the optimal number of cluster is 2 and we achieve a higher value (0, 95) of Silhouette width that validates the good matching between clusters and observations. K-means algorithm gives good results in clustering the data.
Introduction
Big data is poised to cover everything from business and sciences to healthcare, agriculture, education, economics, and government. This explosively big quantity of data generated makes our time the data age. The question is: What is the interest in collecting information if we are not going to benefit from it? Performant and powerful tools are absolutely needed to transform the gigantic amount of data to valuable and organized knowledge. Here comes the necessity of data mining and machine learning tools. The most essential thing is that big data is not about creating machines and materials that calculate data but is about creating value from data to get new knowledge [1].
Actually data mining uncovers valuable information from a large collection of data that cannot be obtained through only individual data. Many researches describe the power of data mining in detecting and predicting outcomes [2,3,4]. For instance, Google’s Flu Trends detect flu activity by using a specific search terms in Google search. It can do this by combining the number of people who search for any information about flu and the number of people who actually have flu symptoms. When search queries about flu activity increase, a pattern emerges. Also, Amazon can suggest or recommend the ideal book for you, Google can produce an answer in a very near real time, spam filters are used to automatically detect unwanted email and keep it away from user’s inbox based on certain criteria, and the autocorrect feature in our smartphones adds new words to its dictionary based on our actions and on what we type.
At its core, big data is about predictions. It became a synonymous of data mining, business analytics and business intelligence; and has made a big change in BI from reporting and decision to predicting results [5]. Big data is not about collecting data, storing data or teaching machines to think and react like humans. Instead, it is about applying math to huge amount of data so as to give probabilities: the strong possibility that an email is a spam, a person is walking, stilling or running, or typed letters “alne” are supposed to be “alone”. The number of predictive examples is endless. The major key is that these systems including reality mining process operate well because of the quality of data on which they base their predictions.
After all, with the use of machine learning methods and statistical analytics, reality mining can now give a general picture of our individual and collective lives [5]. For this, we propose to apply data mining techniques and big data predictive analytics on data coming from mobile phones and sensors, to get the more accurate prediction. The real challenge of our study is to combine both big data and reality mining applied to smart phones and sensors’ data to predict patterns by proposing a solution which can be applied to any data prediction case study such as stress, pollution, weather, obesity, depression prediction, among others.
Related works
In the past few years, many researches were centered on the use of data mining tools in predicting outcomes in different areas such as: education, healthcare, weather, pollution, among others.
Authors in [6] presented big data tools and techniques in healthcare system; clarifying their effective and useful sides. They conclude that the integration of big data tools, data mining, medical informatics and big data analytics techniques; has the potential to make an important effective changes in healthcare delivery costing and healthcare outcome.
Authors in [7] assert that clustering is the most powerful tool used in several forecasting domains. In their study, they propose a methodology of k-mean clustering for weather forecasting and got a list of weather categories based on the peak mean values of the clusters. When new data are presenting, K-mean affect it to the appropriate defined cluster. Therefore, they were able to predict weather events. Performance and correctness of their approach is also measured.
A performance comparison of four main machine learning algorithms: support vector machine (SVM), decision tree (C4.5), naive Bayes (NB) and k nearest neighbors (k-NN) on the Wisconsin breast cancer (WBC original) datasets is conducted [8]. In this study, authors achieve the correctness in classifying data with respect to efficiency and effectiveness of each algorithm in terms of accuracy and precision. The research shows that SVM make a good performance by reaching a highest accuracy (97.13%) with the lowest error, compared to the use of K-NN, NB and C4.5 classifiers.
The neuron-fuzzy technique was applied to the same previous dataset Wisconsin breast cancer [9]. They reached an accuracy of 95.06% with tenfold cross validation. In their work, a hybrid method is proposed to enhance the classification accuracy and achieved an accuracy of 95.96%.
The first academic literature review of the use of data mining tools to customer relationship management (CRM) applied to an academic database between the periods of 2000–2006; proposed a classification methodology to classify articles [10]. Eighty-seven papers were selected and classified. Papers were classified on four CRM categories (Customer Attraction, customer Development, Customer Identification and customer Retention) and seven data mining techniques (Classification, clustering, Regression, Forecasting, Association, Visualization and Sequence Discovery) were evaluated. The process of classification was independently verified. The research shows that the customer retention cluster got the most research attention. The goal of this analysis is to facilitate knowledge and guide future research applied to CRM using data mining tools.
Authors in [11] propose a new algorithm for predicting the next inter-cell activity of a mobile user covered by a Personal communication Systems network. The algorithm proposes three important phases: using the history of mobile user trajectories as user mobility patterns, extracting rules from the patterns collected and finally predicting outcomes based on these rules. The proposed method was compared to two other prediction methods. Results show that the performance of the new algorithm is better than other methods in terms of precision and recall.
Authors in [12] present a model for prediction of stillbirth based on medical history and maternal characteristics and evaluate the performance of the model. The study was conducted by using 76.897 singleton pregnancies. Logistic regression data mining method is used to determine if there is any contribution to predict stillbirth from several parameters: the maternal factor-derived a priori risk, fetal nuchal translucency thickness (NT), ductus venosus pulsatility index for veins (DV-PIV), uterine artery pulsatility index (UT-PI) and maternal serum free ß-human chorionic gonadotrophin (ß-hCG) and pregnancy associated plasma protein-A (PAPP-A). The most significant characteristics were valued to build a model for prediction.
In a study [13], five different data mining algorithms on various wind farm datasets are tested. Authors examine the predictions of the power of a wind farm at different time ranges: 10 min and hour-long interval. The support vector machine performs well and gets accurate predictions of wind speed and wind power at 10-min intervals up to 1 h into the future, while the multilayer perceptron algorithm is more powerful and accurate over hour-long ranges up to 4 h ahead. Tests were generated based on a wind farm of 100 turbines.
The development of effective predictive and perspective analytics systems relies on the use of advanced and preformed technologies such as big data, advanced analytics tools and intelligent systems. Including real time data gathered from mobile phone/sensors during prediction process allows users to be more involved and represents a real asset for prediction. Indeed, the proposed system allows sending future users real time predictions, and proactively recommends them according to the case study. The system takes advantage of data collected from healthcare sensors and mobile phones, data mining algorithms and big data processing tools.
The rest of this paper is illustrated over a few sections starting with the conception and the implementation of the proposed prediction system; including prediction process, gathering data and big data tools and management; in “Methods” section. “Results and discussion” section illustrates the proposed system applied to miscarriage prediction case study by presenting the environment of our experiment, metrics, required configurations and experimental results. Finally, we conclude the paper and give perspectives.
Methods
The proposed prediction system
The use of mobile phone has the advantage of providing both real time measurements and contextual information. Activities such stilling, driving, walking, running or biking can be recognized thanks to the use of smartphones. Also, real time location (all the places visited by users) through GPS (global positioning system) and google place service is now possible. Furthermore, other personal data such as age, gender or weight can be collected through mobile applications. All collected data can be managed by an advanced database server and in a big data management framework in order to predict outcomes.
The main contribution of the system is that it makes use of immediate contextual parameters which can be retrieved from the users’ devices and healthcare wearable sensors to help forecasting. As a result, users are always aware about their health state to react in advance in case of probable outcome.
As result, the main features of our system are (see Fig. 1):

Prediction system overview
-
An effective communication with the users. They receive relevant information about their actual status.
-
Integration and management of a huge amount of data.
-
Use of real-time data: receive real-time information such as location, activity, sms, voice call …etc.
-
Use of advanced big data management tool.
-
Prediction of patterns: using both personal data and real time data.
Reality mining for gathering data
Cataloguing and collecting information about individuals helps to better understand people’s habits. Using machine learning methods and statistical analytics, reality mining can now give a general picture of our individual and collective lives through mobile phones and sensors.
In the specific field of healthcare, the main goal is how to use both big data and reality mining to make people’s live easier and healthier. Thanks to mobile phones, healthcare sensors, big data and reality mining tools, predicting outcomes and making quick decisions in advance is now possible. New mobile phones contain different kinds of sensors (e.g. location sensors, motions sensors among others). Wearable and healthcare sensors have the capability to give relevant information about people’s behavior and habits. After all, with the use of machine learning methods, statistical and predictive analytics, reality mining can now give a comprehensible picture of our collective lives.
Gathering process overview
Gathering data is a very challenging module because predicted results will depend on what we collect. For that, information must be accurate and credible to get the right prediction. In our study, users interact with mobile phone and sensors which are equipped with internet communication unit as follows:
-
Users register personal information that could be updated in case of any required change.
-
Mobile phones collect real-time data about users such as: activity, location, voice call …etc.
-
Wearable healthcare sensors generate various data about the behavior of the user.
Mobile devices then upload all gathered data in files to a central server to be analyzed and to generate the suitable results.
Figure 2 illustrates the proposed data gathering process.

Data gathering process
IoT systems: sensors integration and implementation
Sensors are the source of Internet of Things (IoT) data and sensor technology is becoming so advanced. Today we can detect things that were not previously possible. In IoT systems, a sensor is used to collect data and route to a control center where decision is made.
For that, multiple IoT health sensors were used to monitor attributes namely; heart rate variability (HRV), blood pressure, emotion, temperature variation (TP) and activity (see Table 1).
Many tools exist for managing sensors. We suggest using Arduino (an open-source platform) for gathering data from health sensors and Raspberry Pi (a single-board computer) for programming and processing [14]. The main purpose of this deployment is to collect and stream large data about the user as presented in Fig. 3.

Gathering sensors data workflow
Pulse sensor, temperature sensor and acceleration sensor are directly connected to the Arduino tool that collects data every 3 s. In fact, Arduino checks if there is any information measured sent from healthcare sensors; if it is the case, it collects and puts the values of heart rate, body temperature and activity in a JSON file. This file is; in its turn; sent to raspberry pi for processing (see Fig. 3).
The mobile application; connected to raspberry pi with a TCP/IP protocol; is always listening and store patient’s data in a server. Then, they are analyzed in a big data management tool using machine learning algorithms (see Figs. 2 and 3); this process is repeated every 60 s. In our study, we gathered 100,000 documents that contains all healthcare data from both mobile phones and sensors.
Prediction process
As shown in Fig. 4, to obtain the predicted result and forward it to the user, we are making the following process:

Prediction transmission process
-
1.
Gather and store data in database server in files: data collected from wearable healthcare sensors and mobile phones are transmitted to a No SQL database server to be stored.
-
2.
Extract data from the database server to the Cloud: all data collected and stored in the database are, then, extracted by the big data management tool in the Cloud to be treated.
-
3.
Transform data: some data mining algorithms require having data in specific types. So, we are asked to transform the type of data that are not in the appropriate type.
-
4.
Analyze data transformed: apply machine learning algorithm on our dataset and make the necessary changes that meet our needs.
-
5.
Make predictions: once analyzing process terminate, we can get our predicted results and visualize them in different way (charts, tables, graphs…etc.).
-
6.
Evaluate and validate the model: the predicted result is not enough and not very equitable to validate the model; an evaluation and validation step is widely important to be sure that our prediction process is accurate and we are sure to communicate the right information to the user who will take a decision based on transmitted results.
-
7.
Present the final response: once the model is evaluated positively, final results are transmitted to the user who is also able to send a query in his turn.
Both prediction process and data gathering process are important in making predictions because they are complementary. Gathering the wrong data or having a weak prediction process (even with right information) will cause false results to be sent to the target user. These processes are particularly critical in healthcare field where human lives could be threatened by erroneous decisions.
The prediction process is a crucial stage in our work and is based on four main tasks. The first one is the data extraction stage, which relies on choosing the right data for the analysis phase. The analysis stage is the second phase. It aims to find the optimal configuration of data mining algorithm and data selected. The main objective of this phase is to minimize the error rate of prediction. The third phase is the prediction part in which we predict patterns from results during analysis phase. The fourth stage is the prediction evaluation and validations where we evaluate and validate the performance of our model using algorithm metrics and algorithm statistics validation.
Data conceptual modeling and implementation
Big data management tool
Over time, a huge amount of data is created every second and reaches critical sizes. For this, several solutions are proposed for large scale data processing. The leading solutions in the market are Spark and Hadoop [15].
Spark and Hadoop both are big data frameworks, but they do not really have the same usage. MapReduce’s operating mode may be sufficient if operational requirements and reporting requirements are essentially static and it is possible to wait for the completion of batch processing. But if you need to analyze data in streaming, as is the case for processing sensor data in a plant, or if applications require a succession of operations, you will probably need to use Spark. This is the case for most machine learning algorithms that need to perform multiple operations. Spark is perfectly suited for real-time marketing campaigns, online product recommendations, cybersecurity and machine log tracking.
In this work, we propose the use of Databricks Apache Spark as a big data management tool for reasons mentioned above. Databricks is a virtual analytics platform for data integration, real-time exploration, and pipelines’ production in the cloud, powered by Apache Spark. It represents the best place to Run Apache Spark as a production data science and engineering platform [16].
NOSQL database conception
In this work, all data is stored and extracted from Couchbase Server [17]. It is a NoSQL document oriented database, which has become the de facto standard for building Systems of Engagement. It is designed with a distributed architecture for performance, scalability, and availability. It enables developers to build applications easier and faster by leveraging the power of SQL with the flexibility of JSON documents as shown in Fig. 5. Couchbase offers a data platform for mobile, web and IoT composed of two modules: Couchbase Mobile and Couchbase Sync Gateway.

Representation of stored documents
Data mining model
Data mining is known as the process of analyzing different types of data to extract patterns and knowledge by using different data mining tools. Many applications use data mining in their implementation like healthcare data analysis, education system, production control, decision making among others [18].
Various clustering algorithms exist such as: K-means algorithm, Hierarchical clustering algorithm (HCA), Self-Organizing Maps Algorithm (SOM) and Expectation Maximization clustering algorithm (EM). According to [19], the choice of using an algorithm instead of another depends on several parameters: Size of dataset, number of cluster, type of dataset … among others. In fact, the quality of K-means and EM algorithms becomes very good when using large dataset, while HCA and SOM algorithms are used for small dataset.
In this study, we used K-means based centroid clustering algorithm because of the size of our data, its popularity and simplicity to understand. It is an unsupervised machine learning algorithm that solves the well-known clustering problem. In K-means algorithm, probability of the most relevant function is calculated, and functions are clustered using Euclidian distance formula. K is an input to the algorithm for predictive analysis; it is the number of groupings that the algorithm has to extract from dataset. So, K-means split data into K clusters. The aim of this algorithm is minimizing a squared error objective function given by [20, 21]:
where, “||xi − vj||” is the Euclidean distance between xi in X = {x1, x2, x3, …, xn} is the set of data points and vj in V = {v1, v2, …, vc} is the set of centers.
System implementation
An overview of our system implementation is presented in Fig. 6. Actually, Couchbase Mobile simplifies an “offline first” development of our mobile application that communicates directly with the local database by performing CRUD operations. Couchbase Lite will then run locally on the device and store data as JSON format. In turn, Sync Gateway exposes a database API for local database to replicate to and from Couchbase Server. This connection is made using the Database Change Protocol (DCP) that replicates data memory-to-memory from the source cluster to the destination cluster before being written to disk on source cluster, without the data persisting in Sync Gateway [22]. Application in Databricks extracts JSON files from Couchbase server; analyze them using the same process described in Fig. 4 and sends results to the user making them available in the front end user interface of the mobile application.

Overview of our system implementation
Results and discussion
Miscarriage risk factors definition
Typically, risk factors or inputs in the healthcare system include echography, doctor note, and ultrasound screening. To make “predictions”, doctors wait for patient’s consultation to make an ultrasound screening to see if there is anything wrong. And in most cases, it is always too late to avoid unsuitable results which can be the death of an unborn child in the case of miscarriage. The use of mobile phone shows its power on providing both real time measurements and contextual information [23, 24]. In this study, we define two types of data sources:
-
Data from sensors:
-
Heart rate variability [number of beat per minute (BPM)]; It represents a great marker of stress and health. An elevated heart rate is always associated with an increased risk of hypertension and an elevated blood pressure [25].
-
Stress and blood pressure; they are deduced from the value of heart rate variability. In fact, a maximum heart rate variability (HRmax) is calculated with the equation of
-
“208 − 0.7 * age” [26]. Depending on the value of HRmax, stress emotions and blood pressure values are defined.
-
Temperature variation; as in any systemic infection in pregnant women and other viral infections, there is an increased risk of spontaneous miscarriage or premature delivery. In previous epidemics, miscarriages related to increased body temperature and flu, have been reported [27].
-
Physical Activity; as mentioned in “Introduction” section, a strong exercise of the body increases the risk of getting miscarriage.
-
-
Data from mobile phone:
-
BMI (body mass index); obese and underweight women have an increased risk of miscarriage. It is a value derived from height (H) and weight (W) filled by mobile application’s user. BMI equation is presented as:
-
BMI = W (kg)/W2 (m) [28].
-
Number of previous miscarriages; woman who got a previous miscarriage is more likely to have another one. It is a data collected from mobile application’s user profile.
-
Maternal age; increased maternal age increases probability of getting miscarriages. It is a data collected from mobile application’s user profile.
-
Location; all the places visited by users are defined through GPS and google place service. This parameter helps to define the quality of eating well. In fact, by knowing the location of pregnant woman, we can expect her activity: for example, if she stays in restaurant for a long time, there is a high probability that she is eating in restaurant. Also, by knowing the frequency of being in a place, we can deduce here food quality: if the frequency of being in a place tends to be 1, it means that her food quality is not good since she is pregnant. Pregnant women are asked to eat at home for some hygiene protections.
-
Current activity; thanks to the accelerometer in the smartphone and vibration sensor, we can recognize activities like stilling, driving, walking, running or biking, among others.
-
All those data are sent continuously to an advanced database server and stored in files, which will be extracted and analyzed by unsupervised machine learning algorithms in a big data management framework in order to determine if the pregnant woman will have miscarriage or not and to propose recommendations and pieces of advices as well.
Experiment
Experiment environment
In this study, several tools are used to create our miscarriage prediction system:
-
Database server: Couchbase Database Server was installed in a network machine with a public IP address.
-
Big data platform: Databricks Spark; Spark 2.1 and Scala 2.11 as a programming language.
-
Mobile tools: Android Studio 2.2.2 for coding the mobile application and smart phones for running the application.
-
Sensors managers: Arduino UNO and Raspberry PI 3.
System dataset
In this work, dataset is created through our mobile application “e-Preg Monitoring”. It collects automatically real-time data about the pregnant woman every 60 s while the application is on active mode. Our study relied on around 100,000 documents gathered and 15 valued attributes. We can find more information about the dataset in [29].
Table 2 lists a description of attributes and their meaning, used in the created dataset; while Tables 3, 4, 5 and 6 present respectively values and meaning of activity, location, BMI, heart rate, stress and blood pressure attributes.
To detect the current location of the woman, different place identifiers are supported by google place services [30]. We used over 100 types of location. Table 6 presents 6 types of places out of all places we use, by presenting the value attribute in our dataset and its meaning.
Stress and blood pressure values are defined based on the Heart Rate Variability (HRV) value. In fact, a HR range is proposed for each age category [31]; we used categories of 20 to 50 years: (aged 20 years, ranged 100 to HRmax), (aged 30 years, ranged 95 to HRmax), (aged 40 years, ranged 90 to HRmax), (aged 45 years, ranged 88 to HRmax), (aged 50 years, ranged 85 to HRmax). Table 3 describes stress and blood pressure meaning of 20 and 30 years categories.
Algorithm metrics
Once we get data from the server, we start building the predictive model. Apache Spark MLLIB treats Kmeans as a model (KMeansModel) that has to be trained with data, and then can be applied to new samples as if it was performing classification. While odd, this actually is a bonus because it easily allows us to use our clusters as a classification model for unseen data.
Our dataset contains some attributes that will not be used in our prediction such as: “type”, “time”, “time”, “ID” and “user_email”. Thus, we have to identify attributes to be passed to K-means for prediction. Then we have to assemble all the dataset to a vector class. So, we can use the KMeansModel for analyzing and predicting results which will be shown in the front end user interface.
-
1.
We, first, converted the data to a Resilient Distributed Datasets (RDD) to be passed to K-means for prediction (see Figure I):
Figure I 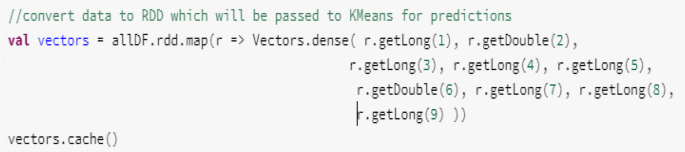
Creation of K-means vectors
Where “allDF” represents the dataset and “r.getInteger(1), r.getDouble(2), r.getInteger(3), r. getInteger(4), r. getDouble(5), r.getDouble(6), r.getLong(7), r.getLong(8), r.getLong(9)” represent respectively the value of age, BMI, nMisc, location, temp, BPM, stress and BP attributes.
-
2.
We, then, applied the K-means algorithm on the vectors created above, identified the number of clusters K, the number of iterations and K-means mode parameters (see Figure II):
Figure II 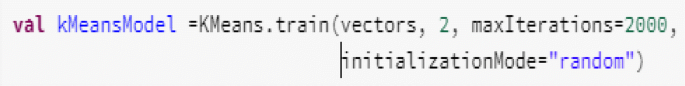
Implementation of Kmeans model
Where“2” is the value of K, “2000” represents the maximum number of iterations and “random” is the K-means mode.
-
3.
As a third step, we make predictions to visualize the cluster of each sample (see Figure III):
Figure III 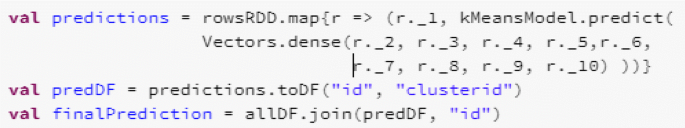
K-means predictions and cluster distribution
Where “r._2, r._3, r._4, r._5, r._6, r._7, r._8, r._9, r._10” represent respectively attributes of age, BMI, nMisc, location, temp, BPM, stress and BP attributes. While “clusterid” is the Kmeans cluster.
-
4.
Finally we transmitted the results to the doctors who can visualize them in the mobile application:


Results can contain two possible values: “0” or “1” as presented in Table 7.
Experiment results
As an example, all results presented in this section relied on results of real pregnant women that have our mobile application installed and get notifications on their state of pregnancy and how they are far from a spontaneous miscarriage (Figs. 7, 8, 9, 10, 11).

Screenshot of doctor’s result interface

Screenshot of doctor’s patient list

Screenshot of patient’s recommendations

Screenshot of activity’s recommendations

Kmeans scatter plot
Performance and efficiency
With respect to the accuracy of the algorithm, the faster the model creation is, the faster the results are transferred to the user. So, the time required to build the model and the cluster distribution are important parameters during prediction outcomes. Table 8 shows some parameters that we deduce during our analysis:
Clusters definition and distribution
After loading and parsing data, we use the Kmeans object to cluster the data into two clusters and build the predictive model based on the following predictive attributes: age, BMI, nMisc, location, temp, BPM, stress and BP. The number of desired clusters is passed to the algorithm. Results can be transmitted to the doctor who can monitor and track his patient easily to make a quick decision in case of an emergency.
Kmeans scatter plot
From the plot presented in Fig. 12, we can see that “feature3”, “feature4”, “feature5”, “feature6”, “feature7”, “feature8” and “feature9” (described in Table 9) are the most representative attributes in clustering data because of many reasons:
-
The pregnant woman can do many types of activities during the day,
-
She can go to different places during the day,
-
Her body temperature can increase or decrease,
-
HRV can increase or decrease, so do stress and blood pressure values.
-
The body of pregnant woman evolves during pregnancy; she can lose or take weight. So BMI indicator changes also even if it is not a representative feature in this case, but it showed his effectiveness in a previous experience.

Scatter plot of Kmeans clustering with relationship of features
Variations of each attribute are presented in Table 10.
Typically, all those attributes are collected by sensors and mobile phone application in real time. Other features remain strong risk factors and more representative as it is better seen in Fig. 13. The smooth orange lines presented through the scatter plot help to see the degree of relationship between variables and foresee trends.

Elbow method plot
The understanding of the scatter plot can be confusing and pretty straightforward. Each row, in this case, that is each value of feature is represented by each circle (blue or orange) on the two dimensional space with X axis and Y axis. Values represented in each side of the plot try to express as much of the original information data; gathered from healthcare sensors and mobile phones; that is expressed by nine attributes that represent risk factors of miscarriage in the dataset.
If we consider for example, feature 7 (Stress) and feature 8 (BP): we find that orange points and blue points form two clusters: either one on the left and another on the right, or one on the bottom and another on the top. The left and bottom cluster is of features that tend to be low in terms of value of heart rate, activity, stress, temperature, BMI, age, location, BP, and nMisc; while the right and top cluster is of features that tend to be high of value of features.
Evaluation and validation
Evaluation using a random K
Minimizing the sum of squares of distance among the points of each group (the squared Euclidean distance) is the aim of Kmeans algorithm. Once we get prediction results, it remains important to evaluate the obtained model and check whether the model is representative of the data.
KMeansModel Objects present clusters and we chose a “K” value of 2. To, check if our proposition of this value of “K” is appropriate or not, we called the Within Set Sum of Squared Errors (WSSSE) [32]. It represents the Kmeans clustering metric for evaluating KMeansModel and is the sum of the distances of each observation in each “K” partition. In principle, we get better results when “K” gets higher because we reduce the squared error. But a higher value of K may not produce useful and meaningful clusters.
Table 11 presents different cases of “K” value and the corresponding value of WSSSE we get.
Choosing a “K” value of 1 is not appropriate since the goal of our study is to cluster our data in different groups of objects. We should also look at where we start getting lots of small and meaningless clusters with small value of WSSSE. 3 as value of “K” split our dataset into three categories; with the lowest value of WSSSE 546.35 reduced by around 75% from the previous case. It means that the doctor will receive three different results about a patient while our need is just to know if a woman has more probability to have miscarriage or not to give him the opportunity to take the right decision.
So, the best value of “K” we may choose is 2. The WSSSE of our randomly choice of “K” is 978.24; error was reduced by around 55% compared to the results obtained previously with 1 value of “K”. This is a good result in the case of miscarriage prediction since we need two meaningful clusters with the lowest value of WSSSE possible.
Clustering validation metrics
Evaluation step is not enough to validate the model. To make sure that our choice in terms of number of clusters and machine learning algorithm, it is necessary to validate the quality of the result after clustering our data. Many varieties of measures have been proposed in literature for evaluating clustering predicting results. We can categorize those clustering validation statistics into three main categories [33,34,35]:
-
1.
Relative clustering validation (RCV): it evaluates the clustering structure. It is generally used to determine the optimal number of K. In this validation type, we used the Elbow method.
-
2.
Internal clustering validation (ICV): this validation uses the internal information of the clustering process to evaluate the goodness of a clustering structure without reference to external information. In this validation type we used the Silhouette index.
-
3.
External clustering validation (ECV): it is used when comparing results of a cluster analysis to an externally known result. In our case, we didn’t use this type of validation because all miscarriage prediction found in literature; as we presented in the “Introduction” section; are based on data from images, echography’s and consultations. While, our predications are based on real time world data to make predictions. ECV can be done; in probable future works; by selecting the right clustering algorithm for a specific dataset.
i. Relative clustering validation (RCV): elbow method
The basic theory of clustering methods remains on defining clusters such that the total intra-cluster variation/or total within-cluster sum of square (WSS) is minimized. The total WSS measures the compactness and efficiency of the clustering and we want it to be as small as possible.
Elbow analysis
The Elbow method looks at the total WSS as a function of the number of clusters. We should choose a number of clusters so that adding another cluster doesn’t improve much better the total WSS. The optimal number of cluster is defined by the following process:
-
1.
We compute clustering algorithm for different values of k (e.g.: from 1 to 4).
-
2.
For each k, we calculate the WSS.
-
3.
Display a plot of WSS according to the number of clusters k.
-
4.
The location of a bend (knee) in the plot is considered as a strong indicator of the appropriate number of clusters.
Elbow results
To display results presented in Fig. 13 and obtained by the Elbow method to see the optimal number of cluster we used the function “fviz_nbclust”:
From the plot illustrated in Fig. 13, we can notice that the Elbow method suggest 2 as value of K; which is a good indicator of the reliability of results obtained in our study.
ii. Internal clustering validation (RCV): Silhouette method
In general, internal validation measures evaluate the connectedness, the compactness and the separation of the different cluster partitions. In fact, through this type of validation, we evaluate:
-
How close are the objects within the same cluster? A lower variation of within-cluster is a good indicator of a good compactness and good clustering.
-
How well a cluster is separated from other clusters?
Generally, most of indexes used in internal validation combine both compactness and separation metrics as follows:
where α and β are weights.
Silhouette analysis
Silhouette analysis measures how well an observation is clustered and it estimates the average distance between clusters. The silhouette plot displays a measure of how close each point in one cluster is to points in the neighboring clusters. For each observation i, the silhouette width Si is calculated as follows:
-
1.
For each observation i, we calculate the average dissimilarity ai between i and all other points of the cluster to which i belongs.
-
2.
For all other clusters C, to which i does not belong, we calculate the average dissimilarity d(i,C) of i to all observations of C. The smallest of these d(i,C) is defined as bi = minC d(i,C). In fact, we can say that the value of bi is the dissimilarity between i and its “neighbor” cluster.
-
3.
Finally, the silhouette width of the observation i is calculated by the formula and ranges between − 1 and 1:
Silhouette results
To display results presented in Fig. 14 obtained by the Silhouette method to validate clusters, we can use either the function “fviz_silhouette” or the function fviz_nbclust:

Silhouette method plot
# silhouette Method using fviz_nbclust
fviz_nbclust(df, kmeans, method = ”silhouette”) + labs(subtitle = ”Silhouette method”)
# silhouette Method using fviz_ silhouette
fviz_silhouette(silhouette) # data visualization using library(factoextra)
si.sum < - summary(silhouette) #Summary of silhouette analysis
si.sum$clus.avg.widths # Average silhouette width of each cluster
We can categorize results of Si values found by the Silhouette method into three main groups:
-
Si is almost 1: observations are very well clustered (K = 2, Si = 0.95).
-
Si is around 0: the clustering configuration may have too many or too few clusters (K = 3, Si = 0.36) or objects are not very well matched to their own cluster (K = 1, Si = 0.51).
-
Si is negative: Observations are probably placed in the wrong cluster.
From the plot in Fig. 14, we can observe that with 2 value of K, we reach the highest silhouette width (0.95 “almost 1”). It means that observations are very well clustered: every object is well matched to its own cluster (cohesion) and poorly matched to neighboring clusters (separation).
For both Elbow method and silhouette method, some required packages have to be loaded and installed before running methods: library (factoextra), library (cluster), library (fpc) and library (NbClust.
Conclusions
The main contribution of our work is the creation of an e-monitoring miscarriage prediction system using big data tools, data mining techniques and real data. Through this paper, we propose an implementation of a miscarriage prediction system over real time data gathered from mobile application and healthcare sensors. Reality mining shows its power in collecting information about individuals to predict outcomes and save lives; while predictive analytics proves its performance in analysis and prediction phases of prediction process.
In predictive studies, the main goal is having accurate results. And especially in healthcare field; it is critical because peoples’ lives depend on prediction’s result. Also; the use of both machine learning algorithms and statistical analytics makes our proposed system more performant by proposing good predictive results.
The experimental results show that K-means algorithm gives good results in clustering the data. In unsupervised learning, it is difficult to get a result that is 100% accurate because real data is rarely that simple. It is also not easy to choose the right number of clusters. For this, and evaluation and validation are conducted to prove the reliability of predictive results. In fact, 9 risk factors contribute vastly in the prediction process from the extraction of data to the validation of the model, the Elbow method asserts that the optimal number of cluster is 2; which matches with the random number of cluster we used and evaluated. Also, we achieve a higher value (0, 95) of Silhouette width that validates the good matching between clusters and observations. The use of Spark, wearable sensors and the mobile application significantly improved the performance and the effectiveness of the proposed prediction system, especially in terms of processing time.
Availability of data and materials
The dataset generated and analyzed during the current study is available on GitHub platform via the following link: https://github.com/hibaasri/Miscarriage-Prediction.
Abbreviations
- SVM:
-
support vector machine
- C4.5:
-
decision tree
- NB:
-
naive Bayes
- k-NN:
-
k nearest neighbors
- WBC:
-
Wisconsin breast cancer
- CRM:
-
customer relationship management
- NT:
-
nuchal translucency thickness
- DV-PIV:
-
ductus venosus pulsatility index for veins
- UT-PI:
-
uterine artery pulsatility index
- ß-hCG:
-
ß-human chorionic gonadotrophin
- PAPP-A:
-
pregnancy associated plasma protein-A
- GPS:
-
global positioning system
- IoT:
-
Internet of Things
- HRV:
-
heart rate variability
- TP:
-
temperature variation
- WSSE:
-
within set sum of squared errors
- DCP:
-
database change protocol
- BPM:
-
beat per minute
- BMI:
-
body mass index
- HRV:
-
heart rate variability
- WSS:
-
within-cluster sum of square
- RCV:
-
relative clustering validation
- ICV:
-
internal clustering validation
- ECV:
-
external clustering validation
References
Mayer-Schönberger V, Cukier K. Big data : a revolution that will transform how we live, work, and think. Norristown: Houghton Mifflin Harcourt; 2013. p. 242. https://books.google.fr/books?hl=fr&lr=&id=uy4lh-WEhhIC&oi=fnd&pg=PP1&dq=big+data+predictions&ots=Jsl4hgEPIN&sig=_BTyntsT3QMpVvRHDeJziSPn4Mg#v=onepage&q&f=false. Accessed 20 Apr 2017.
Lazer D, Kennedy R, King G, Vespignani A. The parable of Google Flu: traps in big data analysis. Science. 2014;343(6176):1203–5.
Tsuji K, Takizawa N, Sato S, Ikeuchi U, Ikeuchi A, Yoshikane F, Itsumura H. Book recommendation based on library loan records and bibliographic information. Procedia Soc Behav Sci. 2014;147:478–86.
Hewson C, Stewart DW. Internet research methods. NewYork: Wiley; 2016.
Asri H, Mousannif H, Al Moatassime H, Noel T. Big data in healthcare: Challenges and opportunities. In: 2015 international conference on cloud technologies and applications. 2015. p. 1–7. https://doi.org/10.1109/cloudtech.2015.7337020.
Mallu L, Ezhilarasie R. Live migration of virtual machines in cloud environment: a survey. Indian J Sci Technol. 2015;8(August):326–32. https://doi.org/10.17485/ijst/2015/v8i.
Chakraborty S, Nagwani N, Dey L. Weather forecasting using incremental K-means clustering. Int J Biometrics Bioinforma. 2012. http://ciitresearch.org/dl/index.php/dmke/article/view/DMKE052012003.
Asri H, Mousannif H, Al Moatassime H, Noel T. Using machine learning algorithms for breast cancer risk prediction and diagnosis. Procedia Comput Sci. 2016;83:1064–9. https://doi.org/10.1016/j.procs.2016.04.224.
Thorsten J. Transductive inference for text classification using support vector machines. Icml. 1999;99:200–9. https://doi.org/10.4218/etrij.10.0109.0425.
Ngai EW, Xiu L, Chau DC. Application of data mining techniques in customer relationship management: a literature review and classification. Expert Syst Appl. 2009;36(2):2592–602.
Yavaş G, Katsaros D, Ulusoy Ö, Manolopoulos Y. A data mining approach for location prediction in mobile environments. Data Knowl Eng. 2005;54(2):121–46.
Mastrodima S, Akolekar R, Yerlikaya G, Tzelepis T, Nicolaides KH. Prediction of stillbirth from biochemical and biophysical markers at 11–13 weeks. Ultrasound Obstet Gynecol. 2016;48(5):613–7.
Kusiak A, Zheng H, Song Z. Short-term prediction of wind farm power: a data mining approach. IEEE Trans Energy Convers. 2009;24(1):125–36.
Dennis AK. Raspberry Pi home automation with Arduino. 2015.
Anon. n.d. Databricks—the Best Place to Run Apache® Spark™. https://databricks.com/. Accessed 29 Apr 2017.
Anon. n.d. Apache Spark™—lightning-fast cluster computing. http://spark.apache.org/. Accessed 29 Apr 2017.
Ostrovsky D. Pro Couchbase Server—David Ostrovsky, Yaniv Rodenski, Mohammed Haji—GoogleBooks. https://books.google.co.ma/books?hl=en&lr=&id=wtALCwAAQBAJ&oi=fnd&pg=PR5&dq=Pro+Couchbase+Server&ots=5MAgMydrhD&sig=rBAmkg7q1GnzlUNDRgG0j9gLdIw&redir_esc=y#v=onepage&q=ProCouchbaseServer&f=false. Accessed 8 Nov 2017.
Rajalakshmi K, Dhenakaran SS, Roobin N. Comparative analysis of K-means algorithm in disease prediction. Int J Sci Eng Technol Res. 2015;4(7):1–3.
Anon. n.d. Apache SparkTM—lightning-fast cluster computing. http://spark.apache.org/. Accessed 29 Apr 2017.
Bansal A. Improved K-mean clustering algorithm for prediction analysis using classification technique in data mining. Int J Comput Appl. 2017;157(6):35–40.
Wagstaff K, Cardie C, Rogers S, Schroedl S. Constrained K-means clustering with background knowledge. 2001:577-584. https://web.cse.msu.edu/~cse802/notes/ConstrainedKmeans.pdf. Accessed 18 Apr 2017.
Architecture C, Service D, Recovery D, Availability H, Access D. Couchbase server : architecture overview. 2016.
Asri H, Mousannif H, Al Moatassime H. Real-time miscarriage prediction with SPARK. Procedia Comput Sci. 2017;113:423–8.
Dimpfel F. A smart, location based time and attendance tracking system using android application. Integr VLSI J. 2001;5(1):1–22. https://doi.org/10.5121/ijcseit.2015.5101.
Thayer JF, Åhs F, Fredrikson M, Sollers JJ, Wager TD. A meta-analysis of heart rate variability and neuroimaging studies: implications for heart rate variability as a marker of stress and health. Neurosci Biobehav Rev. 2012;36(2):747–56. https://doi.org/10.1016/j.neubiorev.2011.11.009.
Tanaka H, Monhah K, Seals D. Age-predicted maximum heart rate revisited. J Am Coll Cardiol. 2001;37(1):153–6.
Anselem O, Floret D, Tsatsaris V, Goffinet F, Launay O. Influenza infection and pregnancy [French;English] Grippe au cours de la grossesse. Press Medicale. 2013;42(11):1453–60. https://doi.org/10.1016/j.lpm.2013.01.064.
Toma C, Veleva Z, Tiitinen A, et al. High and low BMI increase the risk of miscarriage after IVF/ICSI and FET. Hum Reprod. 2008;23(4):878–84.
Asri H, Mousannif H, Al Moatassime H. Comprehensive miscarriage dataset for an early miscarriage prediction. Data Brief. 2018;19:240–3.
Akanbi AK, Agunbiade OY. Integration of a city GIS data with Google Map API and Google Earth API for a web based 3D geospatial application. 2013. arXiv preprint arXiv:1312.0130.
Moore J. 2016. https://elitehrv.com/normal-heart-rate-variability-age-gender, https://hrvcourse.com/hrv-demographics-age-gender/?afmc=go. Accessed 15 July 2019.
Chai T, Draxler RR. Root mean square error (RMSE) or mean absolute error (MAE)? Arguments against avoiding RMSE in the literature. Geosci Model Dev. 2005;2014(7):1247–50. https://doi.org/10.5194/gmd-7-1247-2014.
Theodoridis S, Koutroumbas K. Pattern recognition & Matlab intro. Pattern Recognition. 2008.
Brock G, Pihur V, Datta S, Datta S. clValid, an R package for cluster validation. J Stat Softw (Brock et al., March 2008). 2011.
Charrad M, Ghazzali N, Boiteau V, Niknafs A, Charrad MM. Package ‘nbclust’. J Stat Softw. 2014;61:1–36.
Acknowledgements
Not applicable.
Funding
Not applicable.
Author information
Authors and Affiliations
Contributions
The author HA developed and implemented the e-monitoring miscarriage prediction system. Authors HM and HAM brought their expertise in the workflow of the system and define the study methodology. All authors reviewed, corrected the manuscript. All authors agreed to be accountable for all aspects of the work in ensuring that questions related to the accuracy or integrity of any part of the work are appropriately investigated and resolved. All authors read and approved the final manuscript.
Authors’ information
Mrs Hiba Asri: A native of Marrakech city (Morocco), Hiba Asri is a PhD Student at Faculty of Sciences and Technologies (OSER Research team at, Cadi Ayyad University, Morocco). She received and engineering degree in Networks, Computer Sciences and Information System in 2014. Her primary research interests include big data, Reality mining, healthcare sector and IoT. She participated and organized many international conferences. She was author of many scientific papers in the field of big data and healthcare.
Pr Hajar Mousannif: is an associate professor and coordinator of the Master program in Data Science within the department of computer science at the Faculty of Sciences Semlalia (Cadi Ayyad University, Morocco). She holds a PhD degree in computer Sciences on her work on Wireless Sensor Networks and Vehicular Networks. She received an engineering degree in Telecommunications in 2005. Her primary research interests include big data, IoT, Human Computer Interaction, and next generation internet technologies. In addition to her academic experience, she chaired the Program Committee of many international conferences. Hajar Mousannif holds two patents on her work on Affective Computing and IoT and was selected among 5 best female researchers in North Africa. She received many international awards such as L’Oréal-UNESCO Award and the Emerald Litterati Prize for Excellence.
Pr Hassan Al Moastasime: A native of Rabat city (Morocco), Hassan Al Moatassime graduated from the Mohamed V University, Rabat (Morocco) in 1988 with a B.S. in applied mathematics. In 1989, he received the M.S. degree in numerical analysis from the Paris Sud University, France. He got a Ph.D. degree in numerical analysis from the Paris Sud University in 2003. After a year, he joined the Faculty of Sciences and Techniques Marrakech (Morocco) as an Assistant Professor. Currently he is a Professor within the Department of Mathematics and Computer Sciences. His primary research interests are numerical analysis, computational fluid dynamic, network systems, and numerical methods for wave equations. He was author and co-author of many peer reviewed scientific papers in the field of numerical analysis.
Corresponding author
Ethics declarations
Competing interests
The authors declare that they have no competing interests.
Additional information
Publisher's Note
Springer Nature remains neutral with regard to jurisdictional claims in published maps and institutional affiliations.
Rights and permissions
Open Access This article is distributed under the terms of the Creative Commons Attribution 4.0 International License (http://creativecommons.org/licenses/by/4.0/), which permits unrestricted use, distribution, and reproduction in any medium, provided you give appropriate credit to the original author(s) and the source, provide a link to the Creative Commons license, and indicate if changes were made.
About this article

Cite this article
Asri, H., Mousannif, H. & Al Moatassime, H. Reality mining and predictive analytics for building smart applications. J Big Data 6, 66 (2019). https://doi.org/10.1186/s40537-019-0227-y
Received:
Accepted:
Published:
DOI: https://doi.org/10.1186/s40537-019-0227-y