- Research
- Open access
- Published:
Cyber risk prediction through social media big data analytics and statistical machine learning
Journal of Big Data volume 6, Article number: 50 (2019)
Abstract
As a natural outcome of achieving equilibrium, digital economic progress will most likely be subject to increased cyber risks. Therefore, the purpose of this study is to present an algorithmic model that utilizes social media big data analytics and statistical machine learning to predict cyber risks. The data for this study consisted of 83,015 instances from the common vulnerabilities and exposures (CVE) database (early 1999 to March 2017) and 25,599 cases of cyber risks from Twitter (early 2016 to March 2017), after which 1000 instances from both platforms were selected. The predictions were made by analyzing the software vulnerabilities to threats, based on social media conversations, while prediction accuracy was measured by comparing the cyber risk data from Twitter with that from the CVE database. Utilizing confusion matrix, we can achieve the best prediction by using Rweka package to carry out machine learning (ML) experimentation and artificial neural network (ANN) with the accuracy rate of 96.73%. Thus, in this paper, we offer new insights into cyber risks and how such vulnerabilities can be adequately understood and predicted. The findings of this study can be used by managers of public and private companies to formulate effective strategies for reducing cyber risks to critical infrastructures.
Introduction
Alvin Toffler, in his 1984 book The Third Wave, illustrates four economic stages in society: the agricultural economy; the industrial economy; the digital economy; and the digital creative economy [1]. Currently, we are in the digital economy, which has generated unicorn and startup companies valued at $US one billion. However, the development of this digital economy has also resulted in increased cyber risks.
In 2014, the following companies were directly affected by cyber risks: Sony Pictures Entertainment (approximately $US 100 million in losses); JPMorgan Chase (approximately $US 250 million in losses); Target (approximately $US 1.2 billion in losses); and Home Depot (approximately $US 90 million in losses). In 2015, the breach at the Anthem Insurance Company exposed the data of 80 million consumers, while the breach at Ashley Madison exposed the data of 37 million consumers. In 2016, a breach in the critical electricity infrastructure of Ukraine and Israel resulted in power outages that lasted several days. More recently, in 2017, ransomware, such as WannaCry and Petya affected numerous companies throughout the world. Indonesia, in particular, experienced data breaches on travel websites, such as Tiket.com and Pegipegi.com, in addition to the websites of Telkomsel, Indosat, Government Regency, Komisi Pemilihan Umum (KPU), Universitas Islam Negeri (UIN), Carrefour, RCTI, Bandung Immigration Office, Dharmais Hospital, and Harapan Kita Hospital [2, 3]. All these events highlighted the fact that cyber-attacks are occurring with more frequency and that cyber risk should be an important issue in business risk management. According to a 2017 study conducted by Allianz (a German financial services company), cyber risk has become one of the top three business risks, after supply chain business interruptions and market volatility risks [4].
In general, corporate entities conduct cyber risk mitigation through insurance and prevention efforts. One of the common prevention methods is periodic monitoring against cyber risk threats through global information websites such as Cvedetails.com. However, since the administrative process can take some time, threat information in the common vulnerabilities and exposures (CVE) database is usually obtained after the actual security incident occurs. However, such information may be discussed more quickly through social media platforms such as Twitter. Therefore, the purpose of this study is to present an algorithmic model that utilizes social media big data analytics and statistical machine learning (SML) to predict cyber risks.
Related studies
Forecasting has always been challenging in every field and for many scientists involved in the current dynamics and interrelated environment. In term of the ongoing development of forecasting science, big data has been taking a dominant role. Big data forecasting has been exploited by the fields of economics, energy, and population dynamics. The most common tools used include Factor models, the Bayesian model and neural networks [5]. Besides, forecasting with big data that includes Time series methodology [6] will be beneficial for manufacturing [7], health care [8, 9], and the retail sector [10]. Meanwhile, in the Tourism sector, big data forecasting plays a significant role [11,12,13]. In summary, it is accurate to say that ample scientific articles use big data to make a prediction, in Politics to predict Indonesian presidential election’s result [14], in Finance to predict capital market price [15], so on and so forth.
However, scholarly articles discussing specifically Cyber risk has not been easy to find. Instead of material related explicitly to Cyber risk, there are a higher number of scholarly articles focus upon Cyber security, i.e. [16,17,18]. Cyber risk per se has been defined as a vulnerability (i.e., weakness) that can be exploited by threats to gain access to certain assets [19]. In this regard, assets refer to either consumers, goods or information, while threats can be software, malware or other malicious technological programs. According to Su Zhang, software vulnerabilities are one of the major causes of data breaches. Thus, cyber risk prediction has become increasingly crucial among public and private companies, especially insurance companies [20, 21]. It is becoming more of a concern since the average time it takes between a vulnerability being identified and an exploit appearing “in the wild” has dropped from 45 to 15 days over the last decade [22].
Scholars have been notified that cyber risk prediction can be performed through SML, which is a discipline that synergizes the fields of mathematics, statistics, and computer science [23,24,25,26]. The purpose of SML is to create an algorithm that not only “learns” from the data but compiles stochastic models that can generate predictions and decisions [27]. Regarding data analysis, there are two different cultural approaches: the data modeling culture (traditional statistics and econometrics) and the algorithmic modeling culture (machine learning) [28]. The data modeling approach, used by 98% of academic statisticians, makes conclusions about the data model, instead of the problem/phenomenon. This approach often yields dubious results, since assumptions are frequently made without evaluating the model itself. Moreover, validation is generally performed by conducting goodness-of-fit testing and residual examinations. Conversely, the algorithmic modeling approach is used by 2% of academic statisticians, yet it is commonly used by computer scientists and industrial statisticians. This approach can be applied for large and complex data analyses as well as smaller data analyses. In this case, validation is usually performed by measuring the accuracy rate of the model(s). According to Breiman, the statistical community is too committed to the exclusive use of the data modeling approach, which, in turn, prevents statisticians from solving actual interesting problems. As the saying goes, “If all a man has is a hammer, then every problem looks like a nail.” [28].
One problem in data analysis, however, is the challenge of “big data” and its “3V” characteristics of volume (which can be relatively large), variety (which can be unstructured), and velocity (which can constantly change and be retrieved from multiple sources). According to Berman, big data is not only viewed as a large subjective measurement, but it is a new paradigm in data analysis that aims to generate the smallest amount of data with the greatest impact [29].
Data collection
The data from CVE is collected from the first year CVE organization was running until the algorithm is built (1999–2017), we need CVE data in total, since it will be a reference for determining the existence of risk based on CVE ID in twitter status, but for Twitter data we only use the last one-year period (2016–2017). This is done to achieve the rationale number of Twitter status’ to learn in the context of machine learning. Thus, the difference of data period between Cve and Twitter is not to compare by period or data amount. Twitter data will be fully referred to CVE data to obtain a cyber or no cyber risk label.
Data collection in this study is illustrated in the following Fig. 1.

Data sources and software relation: This figure explain how we collected the data coming from Twitter and CVE using Statistical software R. The data collected then supplied for the next process to MySQL
The Twitter cyber risk data was downloaded from the platform’s application program interface (API). The keywords used for the Twitter data collection included: vulnerability, exploits, Cve, attack, hack, zeroday, and 0 day. The keyword selection was based on the rationale that the data required for analysis was a vulnerability and the threats were in the form of exploits. Since the vulnerability identification number (CVE ID) of the Twitter status was required to be paired with the vulnerability identification number in the CVE database, the keyword Cve was included. To enrich the threat data, the following keywords were also included: attack, hack, zeroday, and 0 day, all of which were interpreted as threats in the form of exploits.
The CVE vulnerability data was retrieved by downloading the public Extensible Markup Language (XML) data from Cvedetails.com. The downloaded data consisted of the vulnerability identification number (CVE ID), the common weakness enumeration identification number (CWE ID), the number of exploits, the vulnerability type, the publication date, the updated date, and the vulnerability score. Moreover, R software was used to facilitate the collection of the Twitter data, the data analysis, and the algorithm model execution [30,31,32,33]. MySQL data storage software (database) was also used to store the cyber risk data from Twitter and the vulnerability data from the CVE database.
The credibility of the Twitter data source was ensured through the following mechanisms. First, the collected Twitter data only included statuses that contained CVE IDs published on the CVE website. Second, based on the Twitter status and the CVE IDs, it was assumed that the users fully understand the topic. Third, data anomalies were eliminated in the data cleansing process, due to the so-called law of big numbers. Finally, the big data analytics process (through data visualization) was used to detect, validate, and automatically eliminate any data that was deliberately disorientated.
Overall, this study obtained 83,015 vulnerability instances from the CVE database (from early 1999 to March 2017) and 25,599 instances of cyber risk from Twitter (from early 2016 to March 2017). The data analysis was conducted by using a Lenovo laptop with Windows (64-bit, 8 Gb memory) and a 2.3 GHz Core Intel i5 processor. Due to the limited hardware capabilities, only 1000 of the most recent instances from Twitter and the CVE database were analysed. It is important to note that the use of this smaller sample did not affect the prediction accuracy since this study only utilized the latest cyber risk information.
The input variable used as data collection is CVE Id number and Twitter status, containing predefined keywords and CVE Id, and the output variable is a logical label with value ‘1’. This means that indicate the CVE Id in the twitter status is also registered in cvedetails.com and so we can define the twitter status is talking about valid cyber risk, or labeled with value ‘0’ means that the status is contained false CVE Id or not registered in cvedetails.com. In that case we can define the twitter status as not a valid cyber risk. The detail code in R to collect data from Twitter can be followed as the following:


The above R codes and steps are useful to retrieve twitter conversation data from twitter API and stored into a local database and can be rewritten as the following pseudo-code:


Methods/experimental
The term machine learning (ML) was given to the field of study that assigns computers the ability to learn without being explicitly programmed [34, 35]. Statistical machine learning methods can be defined as cases where a statistical relationship is established between the frequencies used and the variable measured without there necessarily being a causal relationship which can be parametric, semi-parametric, or nonparametric [36]. In term of our research, we used SML phase for the basis of our analyses, which included the following stages: (1) identification of the problems, objectives, and data requirements; (2) data collection (explained above); (3) unstructured big data cleansing and organizing; (4) feature extraction and data analysis, where we use DocumentTermMatrix function in tm package in R [37] to create a document-term matrix (dtm). Based on the dtm, we make wordcloud and commonality analysis with wordcloud package [38], Histogram analysis with ggplot2 package [39], as well as cluster dendrogram and pyramid with plot.dendrite and pyramid.plot function in Plotrix package [40]; (5) data training and testing by using SML; (6) accuracy testing and model selection; and (7) model implementation (Fig. 2). Predictions were made by analyzing the software vulnerabilities to threats, based on social media conversations, while prediction accuracy was measured by comparing the cyber risk data from Twitter with that from the CVE database.

Statistical machine learning modelling phase. This is to explain step by step process that we have done to complete the research, specifically using SML to train and test the data
This phase is adopted and modified from Ramasubramanian and Singh [32]. The first two stages (i.e., identification of the problems, objectives, and data requirements; and data collection) were discussed in the previous section. Thus, the following presents the details regarding the other stages in the analysis.
Unstructured big data cleansing and organizing
In this research, big data cleansing was performed through the following steps:
-
1.
Access the Twitter and CVE text data from the MySQL local database via R software (see Fig. 3).
Fig. 3 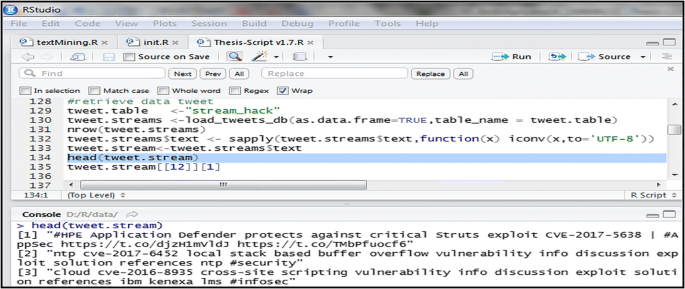
Twitter data stored in MySQL local database. After data collection process has been done, all the data collected is stored in a MySQL database
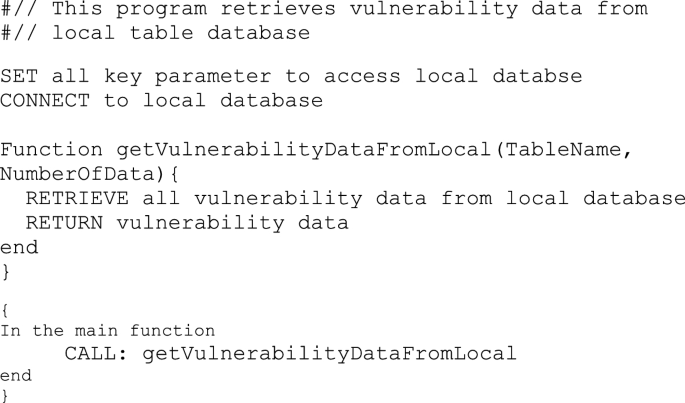
As can be seen in Fig. 3 which the program retrieved twitter conversation data from the local database that can be done by executing the pseudo code below.
-
2.
Change the text data type into a corpus. Each corpus represents a data entity with different topics, stories, sizes, and articles.
-
3.
Clean and organize the text data by using the R tm package (text data processing with text mining) and qdap (qualitative into quantitative analysis transformation). The following are the functions performed in this step:
-
a.
Replace every abbreviation with common words (e.g., dr. with doctor) by using the qdap function: replace_abbreviation (text).
-
b.
Replace every contraction with common words (e.g., is not with is not) by using the qdap function: replace_contraction (text).
-
c.
Replace each symbol with common words (e.g., $ with dollar, and % with percent) by using the qdap function: replace_symbol (text).
-
d.
Replace numbers with words (e.g., 1st with first) by using the qdap function: replace_ordinal (text).
-
e.
Convert the text to lowercase by using the qdap function: tolower (text).
-
f.
Eliminate any common meaningless words listed in the dictionary by using the function tm: tm_map (corpus, removeWords, stopwords (“en”)).
-
g.
Eliminate all punctuation marks (e.g., ! and?) by using the function tm: tm_map (corpus, removePunctuation) function.
-
h.
Eliminate all URLs by using the function tm: tm_map (corpus, removeURL) function with removeURL = function (x) gsub (‘(f | ht) t * \\ S + \\ s *’, “,” x).
-
i.
Eliminate all numbers by using the function tm: tm_map (corpus, removeNumbers).
-
j.
Reduce the middle blank space by using the function tm: tm_map (corpus, stripWhitespace).
-
k.
Eliminate the empty space at the beginning and end of sentences by using the function tm: tm_map (corpus, trim) with trim = function (x) gsub (“^ \\ s + | \\ s + $,” “,” x).
-
l.
Convert the text into a plain text document (so that only normal characters are processed) by using the function tm: tm_map (corpus, PlainTextDocument).
-
a.


The following Fig. 4 is an example of how a Twitter text was cleansed and organized through this process.

Cleaned and organized text examples. This is to give an example of the cleaned and organized data for the next process
Pseudo code for running the cleansing procedure in Fig. 4 which this program retrieves and shows data “before the cleansing process” and “after the cleansing process”, as follow:

Result and discussion
Data that has been successfully collected and cleaned as well as organized based on the mentioned steps from the Twitter is analyzed further by histogram analysis, word cloud and commonality analysis, cluster dendrogram analysis, as well as pyramid analysis. Each analysis will be detailed in the next section.
Feature extraction result and data analysis
The purpose of this stage is to extract and analyze individual words as well as determine the number of occurrences in the corpus. To perform the word analysis, the corpus data type was converted into a term-document matrix (TDM) or a document-term matrix (DTM). This matrix includes a document identification number as a column and terms as a line, with the matrix element as the frequency of terms [41]. Cyber risk analysis was performed by using the TDM data type with bigram syllables (two syllables in one term).
Moreover, the following approaches were applied:
Histogram analysis In this case, the highest frequency bigram in the Twitter conversations indicated that the cyber risk was occurring through apache, apache struts, Yahoo, and Cisco, while the attack methods were using the interactive shell, strutsshell interactive, kitploitstrutsshell, and strutspwn exploit. Based on the findings, Apache was the most trending topic among the Twitter users, see the following Fig. 5.

Twitter N-gram histogram analysis. This is to show that what people speak mostly on Twitter regarding the cyber-attack. It shows cyber-attack occurred mostly through Apache
Word cloud and commonality analyses The word cloud analysis reinforced the results of the histogram analysis; that is, apache struts were the highest frequency bigram, compared to the other related bigrams that discussed apache and struts. The commonality analysis validated that the keywords used in the Twitter and CVE data collection process were appropriate since there were discussions about vulnerabilities in both platforms as it can be seen on the following Fig. 6.

Word cloud, comparison dan commonality analysis results. it shows the result of word cloud and commonality where Apache, Exploit, and Vulnerability is very visible among other words twitted during the period
Cluster dendrogram analysis Based on the cluster dendrogram analysis, the terms apache, struts, shell command, interactive, and exploit were found in adjacent clusters. This finding validates that the cyber risk attack on apache struts was using the interactive shell command exploits, see Fig. 7.

Cluster dendrogram analysis results. This figure shows the result from the cluster dendrogram where the terms apache, struts, shell command, interactive, and exploit were found in adjacent clusters. Thus, validates that the cyber risk attack on apache struts was using the interactive shell command exploits
Pyramid analysis Based on this analysis, apache was the third most frequent unigram in Twitter, compared to the CVE database, thus validating that Apache had the highest cyber risk frequency (Fig. 8).

Pyramid analysis results. This figure shows, once more, that apache and exploit become the two most twitted and then followed by a vulnerability in the CVE database
Data training and testing by using SML
The prediction model can be implemented by labeling all the Twitter cyber risk data. In this regard, the threats in the form of exploits can be labeled as CVEs, while the rest can be labeled as NOTCVEs. The data with the former label indicates that the Twitter status consists of cyber risk occurrences on the CVE website, after which the algorithm will “learn” from the labeled data. In the implementation phase, the model can also determine whether the Twitter status is a cyber risk event. The algorithms used for such predictions are as follows:
-
Naive Bayes This classification is constructed by processing the training data and estimating the probability of each data set, based on the document feature value.
-
K-nearest neighbors For each data set, the nearest Euclidean distance is determined.
-
Support vector machines This classification is determined by generating different data separators that have been optimally calculated by Euclidean distance.
-
Decision trees This tool separates the distance between features repeatedly until the overlapped areas disappear.
-
Artificial neural networks Neural networks in which the connections between the units do not form a cycle or loop.
The following Fig. 9 is an example of how the model was executed by using artificial neural networks and R software.

Artificial neural network model result. This figure shows the result in term of its accuracy to predict the vulnerability from Twitter that will be posted in the CVE database
Executing Fig. 9 can be done with the following Pseudo Code which runs the data that split into two periods: data training period and data testing period into the model using an artificial neural network (ANN).

Accuracy testing and model selection
Accuracy testing was performed by utilizing the following confusion matrix (Fig. 10).

Confusion matrix illustration. This figure illustrates model accuracy by comparing the prediction resulting from the model to the actual condition
In this research, the confusion matrix was used to calculate the accuracy of the predicted results and the actual data proportion. Also, it is important to note the following:
-
Accuracy was the primary measurement used for model selection. It was obtained from the formula (TP + TN)/(TP + FP + FN + TN).
-
Sensitivity was another term for Recall or the hit rate, which presents the true positive ratios. This was obtained from the formula TP// (TP + FN).
-
Positives prediction value was another term for Precision, which presents the ratio of the true positives to the total positives. It was obtained from the formula TP// (TP + FP).
Based on these algorithms, the following accuracy measurement was generated (Table 1).
Overall, the selected model obtained an accuracy rate of 96.73%. Most of the other models were also relatively accurate (approximately 95%), with the one exception: The Naive Bayes (e1071) model (accuracy rate of 55%).
The practical implication of the model
The anatomy of cyber risk occurrence (Fig. 11) can be identified from the following software life cycle:

Cyber risk occurrence illustration. This figure illustrates how the Cyber Risk can occur and where the stage that this research is useful mostly to mitigate the risk’s occurrence impact
-
1.
A software product is finalized, released to the market, and used by consumers.
-
2.
Software vulnerability is found by entities and providers.
-
3.
The provider validates and verifies the existence of the vulnerability.
-
4.
Once verified, the provider informs the consumers and the global CVE vulnerability database manager. The CVE database includes a standardized process of validating information through the stages of declaration, evaluation, and publication. At this point, there is a time lag in which the vulnerability is exposed, but no patch is created.
-
5.
After notification, the provider develops the software vulnerability patch.
-
6.
Patch testing is performed to ensure that the vulnerability has been fixed.
-
7.
The patch is documented to make the consumers understand its function.
-
8.
The patch is released to the market. However, since the average time lag from notification to patch distribution is 100 to 120 days [42], additional vulnerabilities can be exposed.
-
9.
The software provider provides patch implementation support services to the consumers.
In this process, the following points require serious attention:
-
The first point is between Stages 1 and 2, where there is a potential risk that black-hat hackers can discover a vulnerability and exploit it to attack certain users. In this case, there are only two types of users, i.e., targeted users and non-targeted users, both of which are open to potential cyber risk events without an effective mitigation strategy (other than insurance).
-
The second point is regarding the notification process in Stage 4, where vulnerability information for the consumers is also received by the black-hat hackers. For these hackers, such information will increase the potential of additional attacks, since the vulnerabilities have already been revealed by the trusted parties. As stated earlier, there is a time lag in this process. According to Ablon, it takes an average of 22 days from when the vulnerability is published until the exploits are created [43]. On the other hand, the provider will need (on average) 100 to 120 days to develop an effective patch after the vulnerability has been published. The threat at this point is referred to as a “zero-day exploit,” since there is no patch for the vulnerability. Approximately 94% of exploits are created after notification, and roughly 5% are real exploits [44]. In this case, there are only three types of users: users that immediately implement a mitigation strategy after notification; non-mitigating users; and non-targeted users that do not implement a mitigation strategy.
-
The third point is the period after a patch has been distributed. In this regard, a release of a patch can also increase the potential of additional attacks, since black-hat hackers can reverse-engineer the patch code. According to Farmer, it takes (on average) only 9 days for black-hat hackers to create exploits by reverse-engineering a patch code [45].
Finally, the following Fig. 12 is one scenario in which the predictive model can be effectively used by insurance companies that provide cyber risk products.

Predictive model implementation scenario illustration. This figure tells how the result from this research can be useful for the related company, i.e., the insurance company to supply an early warning to their clients
Say that there has been a cyber-attack by a black-hat hacker using “apache struts” vulnerability exploits and successfully penetrate the “X” bank information security system. This “X” bank is not a cyber insurance policyholder. The security breach event is then known by internal parties (information security functions, management) and also by external parties (vendors, customers). This “apache struts” exploits information is then reported to CVE for others to take precautions, but the verification and administration process takes some times to appear on the CVE web site immediately. The same exploits information is also written on social media Twitter status and even becoming viral information. The predictive model will capture and analyze this conversation to then become an automated report for insurance companies that there has been a cyber risk occurrence of “apache struts” vulnerability. Insurance companies will then provide preventive reports (early warning) to all policyholders and recommend to immediately prevent the occurrence of potential cyber-attacks for the same risk patterns. Prevention may include vulnerability patching, tight monitoring or even temporary closing of services if there is no alternative prevention mechanism. Because of the prevention effort for cyber risk occurrence, then the insurance company has reduced the potential spread of risk incident claims. The same scenario can be applied if the affected cyber-attack company is one of the policyholders; the spread of more claims can be prevented with this preventive mechanism (Fig. 13).

Changes in general insurance company value chain. This figure illustrates the opportunity that might be some new value-added service that beneficial for both the insurance company and its customers
To apply the scenario, value chain activity changes are required in the insurance companies. Changes in organization require an additional function to manage and prevent the risk occurrence. This function has objectives to minimize the potential spread of risk occurrence and claim. Below are suggested value chain changes described in the value-added services section, along with the potential for stream revenue generation through new services over the long term,
Conclusion
This article presented an algorithmic model that utilizes social media big data analytics and statistical machine learning to predict cyber risks. The data for this study consisted of 83,015 instances from the CVE database (early 1999–March 2017) and 25,599 instances of cyber risks from Twitter (early 2016–March 2017), after which 1000 instances from both platforms were selected. The data were first, analyzed using descriptive analysis like histogram, word cloud and commonality, cluster dendrogram, and pyramid analysis where we found that word Apache, Exploit, and Vulnerability is the most frequent occurrences. It means that Apache has the highest cyber risk. Then, we make prediction by using algorithm NB, kNN, SVM, DT, and last not the least ANN to make the comparison of those algorithms in terms of the accuracy on the prediction using confusion matrix. Our comparison suggests that ANN is the most accurate among others with an accuracy rate of 96.73%. We also highlight that information delays amid the short time between a vulnerability being identified and an exploit appearing [22, 46]—in cyber risk monitoring could lead to false-negative errors in cyber risk identification and management. A false-negative error is a situation in which vulnerability is not considered a risk, and there is no risk management method for treatment and prevention. However, the threat has already occurred. In that case, the risk has been experienced by consumers as well as public and private companies, especially insurance companies. Therefore, this model can be used by managers to formulate effective strategies for reducing cyber risks to critical infrastructure.
Availability of data and materials
Not applicable.
Abbreviations
- API:
-
application program interface
- CVE:
-
common vulnerabilities and exposures
- CVE ID:
-
CVE identification number
- CWE ID:
-
common weakness enumeration identification number
- DTM:
-
document-term matrix
- FN:
-
false negative
- FP:
-
false positive
- KPU:
-
Komisi Pemilihan Umum (General Election Commission)
- ML:
-
machine learning
- MySQL:
-
My Structured Query Language
- RCTI:
-
Rajawali Citra Televisi Indonesia (National Television Broadcaster)
- SML:
-
statistical machine learning
- SVM:
-
super vector machine
- TN:
-
true negative
- TP:
-
true positive
- UIN:
-
Universitas Islam Negeri (Islamic State University)
- URL:
-
Universal Resource Locator
- XML:
-
Extensible Markup Language
References
Toffler A. The third wave. vol. 53. 1984. https://doi.org/10.1017/cbo9781107415324.004.
Purwanto H. Wannacry ransomware affected 12 institutions in Indonesia: Minister. AntaranewsCom. 2017. https://en.antaranews.com/news/111011/wannacry-ransomware-affected-12-institutions-in-indonesia-minister. Accessed 20 May 2018.
Fransiska N, Agustinus Da C. Two major Indonesian hospitals attacked in “ransomware” storm. http://www.ReutersCom. 2017. https://www.reuters.com/article/us-cyber-attack-indonesia/two-major-indonesian-hospitals-attacked-in-ransomware-storm-idUSKBN1890AX. Accessed 20 May 2018.
Allianz Global Corporate & Speciality. Allianz risk barometer: top business risks 2017. Allianz Risk Pulse. 2017;17:1–14.
Hassani H, Silva ES. Forecasting with big data: a review. Ann Data Sci. 2015;2:5–19. https://doi.org/10.1007/s40745-015-0029-9.
Kirlic A, Hasovic A. A literature review on big data and time series. Int J Sci Res Comput Sci Eng Inf Technol. 2018;1:383–8.
O’Donovan P, Leahy K, Bruton K, O’Sullivan DTJ. Big data in manufacturing: a systematic mapping study. J Big Data. 2015;2:20. https://doi.org/10.1186/s40537-015-0028-x.
Sneha N, Gangil T. Analysis of diabetes mellitus for early prediction using optimal features selection. J Big Data. 2019;6:13. https://doi.org/10.1186/s40537-019-0175-6.
Jayanthi N, Babu BV, Rao NS. Survey on clinical prediction models for diabetes prediction. J Big Data. 2017;4:26. https://doi.org/10.1186/s40537-017-0082-7.
Aktas E, Meng Y. An exploration of big data practices in retail sector. Logistics. 2017;1:12. https://doi.org/10.3390/logistics1020012.
Scharl A, Lalicic L, Önder I. Tourism intelligence and visual media analytics for destination management organizations. Cham: Springer; 2016. https://doi.org/10.1007/978-3-319-44263-1_10.
Xiang Z, Fesenmaier DR. Analytics in tourism design. Cham: Springer; 2017. p. 1–10. https://doi.org/10.1007/978-3-319-44263-1_1.
Song H, Liu H. Predicting tourist demand using big data. Cham: Springer; 2017. p. 13–29. https://doi.org/10.1007/978-3-319-44263-1_2.
Budiharto W, Meiliana M. Prediction and analysis of Indonesia Presidential election from Twitter using sentiment analysis. J Big Data. 2018;5:51. https://doi.org/10.1186/s40537-018-0164-1.
Ouahilal M, El Mohajir M, Chahhou M, El Mohajir BE. A novel hybrid model based on Hodrick–Prescott filter and support vector regression algorithm for optimizing stock market price prediction. J Big Data. 2017;4:31. https://doi.org/10.1186/s40537-017-0092-5.
Zuech R, Khoshgoftaar TM, Wald R. Intrusion detection and big heterogeneous data: a survey. J Big Data. 2015;2:3. https://doi.org/10.1186/s40537-015-0013-4.
Yang Z, Japkowicz N. Anomaly behaviour detection based on the meta-Morisita index for large scale spatio-temporal data set. J Big Data. 2018;5:23. https://doi.org/10.1186/s40537-018-0133-8.
Cardenas AA, Manadhata PK, Rajan SP. Big data analytics for security. IEEE Secur Priv. 2013;11:74–6. https://doi.org/10.1109/MSP.2013.138.
Brewer D. Risk assessment models and evolving approaches. IAAC work. 2000. http://www.gammassl.co.uk/research/archives/events/IAAC.php. Accessed 5 Mar 2017.
Zhang S, Ou X, Caragea D. Predicting cyber risks through national vulnerability database. Inf Secur J. 2015;24:194–206. https://doi.org/10.1080/19393555.2015.1111961.
Zhang S, Caragea D, Ou X. An empirical study on using the national vulnerability database to predict software vulnerabilities. Lect Notes Comput Sci. 2011;6860:217–31. https://doi.org/10.1007/978-3-642-23088-2_15.
The Recorded Future Team. The right threat intelligence for patching 2018. https://www.recordedfuture.com/vulnerability-patch-management/. Accessed 28 Mar 2019.
Hassibi K. Machine learning vs. traditional statistics: different philosophies, different approaches. https://www.datasciencecentral.com/profiles/blogs/machine-learning-vs-traditional-statistics-different-philosophi-1. Accessed 10 Jan 2019.
Munoz A. Machine learning and optimization. Courant Inst Math Sci 2014.
Mitchell TM. Machine learning. New York: McGraw-Hill, Inc.; 1997.
Murphy KP. 1 Introduction (machine learning a probabilistic perspective). Cambridge: MIT Press; 2012.
Salakhutdinov R (Russ). Lectures: STA 4273H (fall 2013): statistical machine learning. 2013. http://www.cs.toronto.edu/~rsalakhu/sta4273_2013/. Accessed 10 Jan 2019.
Breiman L. Statistical modeling: the two cultures. Stat Sci. 2001;16:199–231. https://doi.org/10.2307/2676681.
Berman J. Principles of big data: preparing, sharing, and analyzing complex information. 1st ed. Burlington: Morgan Kaufmann; 2013.
Munzert S, Rubba C, Meibner P, Nyhuis D. Automated data collection with R: a practical guide to web scraping and text mining. 2015;1:1. https://doi.org/10.18637/jss.v068.b03.
Lantz B. Machine learning with R. Birmingham: Packt Publishing; 2013.
Ramasubramanian K, Singh A. Machine learning using R. Berlin: Springer; 2017. https://doi.org/10.1007/978-1-4842-2334-5.
Ravindran S, Kumar Garg V. Mastering social media mining with R. Berlin: Springer; 2015. https://doi.org/10.1002/ejoc.201200111.
Samuel AL. Some studies in machine learning using the game of checkers. II—recent progress. New York: Springer; 1988. p. 366–400. https://doi.org/10.1007/978-1-4613-8716-9_15.
Ratner B. Statistical and machine-learning data mining. 2012. https://doi.org/10.1201/b11508.
Global Working Group on Big Data for Official Statistics. Satellite imagery and geo-spatial data. 2017.
Feinerer I. tm: Text mining package. 2012.
Fellows I. Package “wordcloud.” 2018.
Wickham H. ggplot2: elegant graphics for data analysis. New York: Springer; 2016.
Lemon J. Plotrix: a package in the red light district of R. R-News. 2006;6:8–12.
Feinerer I, Hornik K, Meyer D. Text mining infrastructure in R. J Stat Softw. 2008. https://doi.org/10.18637/jss.v025.i05.
Kenna Security. The remediation gap: why companies are losing the battle against non-targeted attacks. 2015.
Ablon L, Bogart A. Zero days, thousands of nights the life and times of zero-day vulnerabilities and their exploits. 2017. https://doi.org/10.7249/rr1751.
Frei S. Security econometrics: the dynamics of (in)security. 2009. https://doi.org/10.3929/ethz-a-005887804.
Farmer TS (Sr. TSIESMC). Enhancing Customer Security: Commitment and Progress 2004.
Ablon L, Bogart A. Zero days, thousands of nights: the life and times of zero-day vulnerabilities and their exploits. Santa Monica: RAND Corporation; 2017. https://doi.org/10.7249/rr1751.
Acknowledgements
We are thankful for the fruitful discussion with many lectures in the Magister Management, Universitas Indonesia regarding the articles’s writing.
Funding
Not applicable.
Author information
Authors and Affiliations
Contributions
All the authors discussed and contributed to the writing of the paper. Research idea and flow, interpretation of the model result is supplied as well as the article finishing by AS. Most of the paper technicality is done by AA. Both authors read and approved the final manuscript.
Authors’ information
Athor Subroto is a Senior Lecturer in the Department of Management, Faculty of Economics and Business, Universitas Indonesia. His research interests include management science and system dynamics applied to policy engineering for public and private entities.
Andri Apriyana: He is now working as professional at Astra International Tbk. His research interests include actuarial science and non-traditional actuarial application in predictive analytics.
Corresponding author
Ethics declarations
Competing interests
The authors declare that they have no competing interests.
Additional information
Publisher's Note
Springer Nature remains neutral with regard to jurisdictional claims in published maps and institutional affiliations.
Rights and permissions
Open Access This article is distributed under the terms of the Creative Commons Attribution 4.0 International License (http://creativecommons.org/licenses/by/4.0/), which permits unrestricted use, distribution, and reproduction in any medium, provided you give appropriate credit to the original author(s) and the source, provide a link to the Creative Commons license, and indicate if changes were made.
About this article

Cite this article
Subroto, A., Apriyana, A. Cyber risk prediction through social media big data analytics and statistical machine learning. J Big Data 6, 50 (2019). https://doi.org/10.1186/s40537-019-0216-1
Received:
Accepted:
Published:
DOI: https://doi.org/10.1186/s40537-019-0216-1