- Research
- Open access
- Published:
Scalable architecture for Big Data financial analytics: user-defined functions vs. SQL
Journal of Big Data volume 6, Article number: 46 (2019)
Abstract
Large financial organizations have hundreds of millions of financial contracts on their balance sheets. Moreover, highly volatile financial markets and heterogeneous data sets within and across banks world-wide make near real-time financial analytics very challenging and their handling thus requires cutting edge financial algorithms. However, due to a lack of data modeling standards, current financial risk algorithms are typically inconsistent and non-scalable. In this paper, we present a novel implementation of a real-world use case for performing large-scale financial analytics leveraging Big Data technology. We first provide detailed background information on the financial underpinnings of our framework along with the major financial calculations. Afterwards we analyze the performance of different parallel implementations in Apache Spark based on existing computation kernels that apply the ACTUS data and algorithmic standard for financial contract modeling. The major contribution is a detailed discussion of the design trade-offs between applying user-defined functions on existing computation kernels vs. partially re-writing the kernel in SQL and thus taking advantage of the underlying SQL query optimizer. Our performance evaluation demonstrates almost linear scalability for the best design choice.
Introduction
Today, nearly all money exists in form of numbers in a computer, and finance can be considered as a special kind of IT application that represents the flow of money in form of cash flows between different participants. Thus, automated processing seems to be a natural choice and the financial sector should be expected to lead digitization and automation initiatives. It is all the more surprising that not only is this not the case but, on the contrary, the financial sector is lagging behind other sectors. In 2008, when Lehman Brothers went bankrupt at the height of the financial crisis, nobody—neither the big banks nor the regulatory authorities—had the structures and processes in place to systematically measure, even imprecisely, the systemic aspects of the risks inherent in the development of subprime lending, securitization, and risk transfer [1]. As a consequence, the top management did not have an adequate picture of these risks so that they could be denied during the build-up of the bubble and nobody was able to evaluate the implications of the failure of major financial institutions when the crisis eventually hit. The major shortcoming identified by the Basel Committee on Banking Supervision (BCBS) [2] is the banks’ poor capability to “quickly and accurately” aggregate risk exposures and identify concentrations of risk at “the bank group level, across business lines and between legal entities”. In particular, this affects their ability to quickly carry out so-called stress tests, which can be viewed as a particular way to assess the banks’ exposure to risk associated with particular economic-financial scenarios.
Since 2009, banking regulation and oversight has been strengthened, e.g. with the Dodd-Frank act and the Basel III post crisis regulatory reform. This has considerably increased the reporting requirements and the associated costs, however, with limited effects. The problem still is the heterogeneity of the banks’ IT environment and the lack of a data and algorithmic standard that enables automated, transparent, and efficient aggregation of risk positions. There are some initiatives for a standardized description of financial instruments such as, e.g., FIBO [3]. Unfortunately, these endeavors are mostly limited to hierarchical classification schemes (business ontologies) and fail to deliver what is needed for financial analysis.
In our view the reasons for this failure are twofold. First, most current standardization efforts focus on contract data (namely what is called contract meta data) but for financial analytics the cash flows implied by the legal provisions are essential. The latter are represented by algorithms in the digital world. Thus, a suitable standardization of the data must go together with a standardization of the contract algorithms. The ACTUS [4] initiative is so far the only one that is pursuing this approach. ACTUS stands for Algorithmic Contract Type Unified Standard and is a standardization effort of financial contract data and algorithms based on ideas originally presented in [5].

Bow tie structure of the financial system. While input and output are diverse, the core is very restricted and can be represented by a limited number of financial contract types with a standardized data format and standardized algorithms. This combines flexibility of input and output with high efficiency of the core
The second reason is that most professionals do not believe that a standardization as we deem necessary is feasible. This hints at a lack of understanding of some crucial aspects of the deep structure of the financial system. Indeed, we have reason to believe that the underlying structure has the form of a so-called “bow tie” (see Fig. 1) found in many complex systems with a core/periphery network structure and cooperative and competitive interactions between network nodes [6]. The center of the bow tie, which must be highly efficient, reliable and transparent, consists of the financial system’s core functionality, namely the execution and analysis of the myriads of cash flows. These cash flows are bundled together and encoded in financial contracts, i.e., the financial instruments. In order to achieve the required efficiency, reliability and transparency, one needs (i) an adequate standardization of the data the cash flow generating algorithms that together define the contract [7] and (ii) sufficient computational power as well as highly scalable parallel algorithms. The first goal has already been achieved with ACTUS [4], while (ii) is what is presented in this paper. Let us note that the full set of contract types will cover all important financial instruments from fixed rates bonds over symmetrical derivatives as futures and swaps to general basket structures that encompass for example asset backed securities (ABS) and collateralized debt obligations (CDO).
ACTUS builds on the observation that all financial analyses can be reduced to the following three steps: (1) evaluation of the cash flows of all financial contracts for a given state of the economic-financial environment (henceforth referred to as risk-factor scenarios); (2) application of specific analytical transformations to these cash flows, which results in granular analytics; and (3) aggregation of the granular analytics to any desired level. If data and contract algorithms are standardized, steps (2) and (3) consist nearly entirely of linear transformations, for which very efficient parallel algorithms exist. Up to now, this technology has been tested for cases consisting of about \(4\times 10^3\) contracts and up to 100 risk factor scenarios.
In order to scale up the solutions, it is important to notice that steps (1) and (2) can both be processed independently for different contracts and different risk factor scenarios, which means that the computing problem is “embarrassingly parallel” [8]. This property allows leveraging novel and freely available parallel and/or distributed computing technologies in order to solve the problem of modeling and simulating the core of the financial system sufficiently fast. In particular, this is essential for large financial institutions with about \(10^8\) contracts and for Monte-Carlo simulation based analytics where each instrument has to be evaluated under up to \(10^5\) scenarios. Indeed, this results in a Big Data and Big Computation problem with up to approximately \(10^8\times 10^5=10^{13}\) contract-scenario pairs.
Research objectives
In the following, we concentrate on the parallel computing technology for modeling, simulating and analyzing the functional core of the financial system at a large scale. The research objectives address the following questions, which we judge essential for this technology to be deployed in large-scale real-world solutions:
-
Question 1: Can we easily parallelize existing financial kernels?
-
Question 2: Can financial calculations be formulated in SQL and thus be accelerated by taking advantage of a SQL Query Optimizer?
-
Question 3: What is the scalability of running large-scale, real-world financial analytics?
The portfolio of contracts investigated in this paper is limited to fixed income instruments as generalized bonds, annuities and loans with constant rate of amortization. This limitation is unlikely to entail a restriction of the generality of the results of our study as to the scaling behavior because the principles, namely the embarrassingly parallel structure of the problem as explained in Section Case Study, remains the same for all contract types. This is why we expect the core of the results presented in this paper to be valid for all contract types. However, we expect the pre-factors of that scaling behavior to indeed depend on the contract types. A detailed analysis of the computational behavior of these factors for all 30+ contract types, however, is beyond the scope of this paper.
Contributions
The paper builds on preliminary work [9] and makes the following contributions:
-
We introduce a real-world Big Data financial use case and discuss the system architecture that leverages state-of-the-art Big Data technology for large-scale risk calculations.
-
A detailed performance evaluation of user-defined functions (UDFs) vs. SQL processing for end-to-end financial analytics provides insights into optimal design and implementation strategies.
-
Conventional wisdom is that Spark performs dynamic resource optimization. We demonstrate on a real use case the current limitations of the Spark resource manager and discuss potential improvements and lessons learned that are relevant for other large-scale Big Data problems.
-
We sketch a research agenda for extending SQL in order to make it applicable to a wide range of financial applications.
The paper is organized as follows. "Related work" section reviews the literature in the areas of big data and financial analytics. "Background" section provides information on financial data modelling and introduces the ACTUS framework. "Methods: parallel data structure" and "Methods: system design" sections introduce the parallel data structure and the system architecture based on Big Data technology to enable scalable financial analytics. "Results and discussion" section provides a detailed evaluation of parallel financial analytics implemented in Apache Spark running on up to 512 vCPU cores. Finally, the results are summarized in "Conclusion" section.
Related work
Over the past decades, the financial services industry has transitioned from a “small-data discipline” to a “big-data discipline” [10]. Traditional data management techniques no longer seem able to effectively handle the ever-increasing, huge and rapid influx of heterogeneous data and require the adoption of novel Big Data technology [11]. In fact, some areas in the financial domain seem to have applied these novel techniques already. In particular, there exists a large body of literature on Big Data applications in financial (stock) market and economic time series prediction, forecasting [12,13,14], financial crime prediction [15], and business intelligence in general [16]. The adoption of Big Data technology is, however, uneven. For example, there is less momentum of applying Big Data in financial auditing [17]. In financial risk management, large data sets are mainly used for estimating and forecasting stochastic quantities such as stock price volatility [11], which is in line with the use of Big Data technologies for time series prediction and forecasting. Big Data technologies are also used for systemic risk measurement [18]. Simulation approaches to financial risk analysis and management have proven to be an effective tool and a major candidate for the adoption of Big Data technologies [19]. Monte–Carlo simulations, e.g. have a long tradition in financial risk management and What-If scenario analysis is widely used as a forward-looking financial management and regulatory tool.
Recent trends in Big Data technology enable novel dataflow-oriented parallelization. Specifically, Apache Spark [20, 21] and Apache Flink [22] are widely-used open-source engines for Big Data processing and analytics that show better performance than the more traditional MapReduce-based approaches due to reduced disk usage [23] and main memory optimizations. Especially, the introduction of Spark SQL, which integrates relational processing with functional programming, is particularly interesting for data warehousing and data analytics applications across different disciplines and is already widely used both in academia [24, 25] and in industry [26]. Large vendors like IBM use Spark as core engines for their own products but also companies like Toyota and Alibaba use Spark for internal data analysis [27].
However, Big Data technologies have not yet been used for simulation approaches to financial risk measurement that are based on the cash flows generated by individual financial contracts. While building the core to existing analytical platforms [28] and, on a conceptual level, to novel regulatory infrastructure [29], up to now the ACTUS approach has only been tested on a small scale [30]. A large scale test of this approach is the missing element needed in order to build a scalable financial simulation and analysis environment that gets to the core of the financial systems and provides the means to flexibly assess all kinds of risks combined with the capability of flexible, situation-based analytics. At present, such an approach has only been presented at a very high, conceptual level, without working out the technical details. E.g., a concept for automated reporting has been proposed in [29]. This approach uses a combination of blockchain technology as well as the ACTUS data and algorithmic standard for financial contract modeling also used in this paper.
Background
Risk assessment means analyzing a complex system in a special way. Carrying out such an analysis thoroughly and consistently is a formidable task. We argue that common financial risk management infrastructures currently still fall short [2]. However, it is not per se unfeasible if one uses adequate concepts and technology. Typically, it relies heavily on simulation which, besides experiment and theory, is a standard approach in science for understanding complex systems and establishing effective control. If based on “first principles”, simulation of a complex system needs to start at the level of granular data, i.e., the system’s most elementary building blocks. For a bank’s balance sheet, these are the financial contracts (also called financial instruments or assets); they cover the whole financial universe reaching from widely known securities as stocks and bonds to complex derivatives. The balance sheets of even mid-size banks consist of millions of such contracts and their apparent heterogeneity historically has prevented a common analytical treatment. However, the conceptual core shared by all financial contracts is that they define a set of rules governing the exchange of future cash flows. In fact, it is these simulated cash flow streams which provide the input from which all kind of financial analysis can be computed [5]. Accordingly, the process of financial analysis can be decomposed into the following two steps:
-
1.
A simulation step that consists of the generation of the cash flows encoded in the definition of the financial contract (see "Cash flow simulation as non-linear function" section); the core of this step consists of non-linear transformations of the input data onto the generated cash flow streams; they must be specifically implemented for financial contracts to faithfully represented their legal content.
-
2.
The analysis step which consists of linear transformations of these cash flows into meaningful analytical metrices by weighted aggregation; the granular-level analytical results provide the input for higher-level risk analysis and financial analysis in general (see "Financial analytics as linear transformations" section).
These two steps constitute the ACTUS Process of Financial Analysis (APFA); the decomposition is crucial in order to organize financial analysis into an efficient process that can be standardized and automated. They provide two computation kernels described in "Cash flow simulation as non-linear function" and "Financial analytics as linear transformations" sections.
APFA architecture
Building on this understanding, Project ACTUS [4] is developing an algorithmic representation of the universe of financial contracts as the core simulation engine that produces the cash flow stream.
Figure 2 shows the data flow. The data input required for the simulation step essentially consists of contract data and risk factor scenarios:
-
Contract data provide the contractual terms defined in the legal agreements; they determine types, dates,Footnote 1 and amount of cash flows generated by a contract.
-
Risk factors scenarios determine the state of the financial and economic environment under which the cash flows of a contract should be evaluated. Important risk factors are interest rates, foreign exchange rates, prices of shares and commodities but also credit ratings and default probabilities. Important is that their future state is unknown and has to be “guessed” in What-If calculations or randomly drawn in Monte–Carlo simulations.

Data flows in the ACTUS framework with complex, non-linear financial analytics (cash flow generation) and linear financial analytics (financial measurements)
We emphasize that both, contract data and risk factor information, is needed in order to generate the cash flows encoded in a contract. The reason is that the contractual terms often refer to market information such as interest rates in the case of a variable rate bond.
Cash flow simulation as non-linear function
The actual mapping from a given pair of contract data and risk factor scenarios is performed by the ACTUS contract algorithms. Mathematically, this can be represented as non-linear functions. It provides the ACTUS simulation kernel. More formally, consider a set of contracts \({\mathcal S} = \{s_1,s_2,\ldots ,s_n\}\), where contract \(s_i\) is represented by a set of contract attributes \(a_i\), and a payoff function \(P_i\) [4]. Further, let \(\Omega\) represent an m-dimensional risk factor model that describes the current state and dynamics of a set of m market risk factors, \({\mathcal O}=\{\Omega _1,\ldots ,\Omega _m\}\). In general, the \(\Omega _i\) are time dependent and are generated for a set of dates \({\mathcal T}=\{\tau _0, \ldots , \mathrm {T}\}\).
Scenarios \({\mathcal W}^k=\{\omega ^k_1, \ldots ,\omega ^k_m\}\) of \(\Omega\) are generated either “by hand” in form of What-If scenarios or randomly according to a mathematical model in the case of a Monte–Carlo simulation. Notice that the \(\omega ^k_j\) represent time series, \({\omega ^k_j=\{\omega ^k_j(\tau )|\tau \in \mathcal T\}}\). The ACTUS payoff function then maps the contract attributes \(a_i\) and risk factor scenarios \(\omega ^k\) onto a stream of cash flow events \({E_i^k(t_0)=\{e_i^k(t_0),e_i^k(t_1),\ldots \}}\),
Here, \(t_0\) is the reference time that indicates the virtual “now” and typically is the starting point of the simulation and \(T_i^k=\{t_0,t_1,...\}\) denotes the vector of the dates of the cash flow events \(e_i^k(t)\) such that \(t\in T_i^k\). Notice that \(T_i^k\) is typically different for different contract–risk factor pairs \((s_i,\omega ^k)\).
Mapping (1), which is represented by the left horizontal arrow in Fig. 2, represents the ACTUS simulation kernel that produces as result a stream of cash flow events for each contract–risk factor pair. This means that typically two cash flow streams \(E_i^k(t)\) and \(E_{i'}^{k'}(t')\) are equal only if \(i=i'\), \(k=k'\), and \(t=t'\). A simulation with n contracts and k risk factor scenarios will thus result in \(n\times k\) cash flow streams, each consisting of \(m\ge 1\) cash flow events. Since there are about 100 million contracts on a large bank’s balance sheet and Monte–Carlo simulations typically contain about 10,000 or even more risk factor scenarios, these intermediate results can be of the order of Petabytes.
Financial analytics as linear transformations
Turning to the analytical part of APFA, we focus on three important measurements; nominal value N, fair value V, and funding liquidity L. These quantities reflect basic measurements necessary for analyzing and managing different types of financial risks. In fact, nominal value measures the (current) notional outstanding of, e.g., a loan and accordingly provides the basis for exposure calculations in credit-risk departments. On the other hand, fair value quantifies the price of a contract that could be realized in a market transaction at current market conditions, which is what market-risk practitioners are concerned with. Finally, funding liquidity assesses the expected net liquidity flows over some future time periods; it is a key concept used in the treasury department of organizations.
In order to formalize the linear financial analytics, we start from a stream of cash flow events \(E_i^k\). Each event \(e_i^k(t)\in E_i^k\) contains among other information elements the actual cash flow \(f_i^k(t)\) that is exchanged with the counter party and the current notional outstanding \(n_i^k(t)\). From these atomic information elements, the three linear financial analytics can be derived as follows:
where \(\Delta =\{\delta _1,\delta _2,\ldots ,\delta _u,\ldots \}\) defines a set of time periods within which the net liquidity is computed as the sum of all cash flows occurring within these periods. Further, the \(d_i^k(t)\)’s denominate discount factors, which are computed from the interest-rate curve of the corresponding risk scenario \(\omega _k\) and a contract-specific discounting spread.
As can be seen from the analytics functions above the three linear analytical metrics can be conveniently derived from a contract’s cash flow event stream \(E_i^k\). They describe the Financial Analysis Kernel used for the second step of APFA. This kernel has been implemented by means of UDFs but can also be implemented using Spark SQL (see "Detailed design of parallel data flows" section). Notice, however, that apart from simple filter and aggregation operations some of these functions involve also time-arithmetics (e.g. liquidity calculations) and interpolations (e.g. discount factors) and, therefore, are less trivial than it might seem at first glance.
Methods: parallel data structure
In this section we describe the main data structures that are required to perform parallel financial computations based on UDFs and SQL.
In order to design a Big Data architecture for performing financial analytics at scale, we can either split the tasks or the data [31, 32].
-
Task parallelism splits a task into subtasks and executes each sub-task on a potentially different compute node of the computer cluster. In other words, each node potentially executes a different task. This approach assumes that the computational costs of tasks can be mathematically modeled and, on the basis of this information, the tasks can be split in a way that the workload is evenly distributed among the compute nodes. The optimal scheduling of the sub-tasks without under or over utilization of some nodes is often non-trivial and hampers the scalability. This is the main challenge of task parallelism.
-
Data parallelism splits the data and distributes it among the compute nodes in the cluster so that each compute node executes the same task typically on a different part of the whole data set. The main challenge is that distributing the data often results in significant communication costs when input data or intermediate results must be shipped from one compute node to another over the computer network.
Calculating cash flows for financial contracts and performing subsequent financial analytics is an embarrassingly parallel problem that falls into the category of data parallelism. A major challenge is to design a data structure that (1) enables end-to-end parallel computation where (2) each row has to be independent from all the others in order to guarantee maximum parallelism. For the contract data part of the input data (see "APFA architecture" section as well as top left part of Fig. 3) this can be achieved quite easily because contract terms essentially consist of a table (the contract data table) where each row represents a contract and the columns contain the contract attributes according to the definitions of the ACTUS data dictionary .
The risk factor scenarios, on the other hand, are only semi-structured. That is, a single risk factor scenario represents a specific assumption on the future evolution of a multi-dimensional financial-economic environment under which the cash flows ought to be evaluated. We refer to a representation of this environment as a risk factor model and to individual dimensions therein to risk factors. Examples of such risk factors are prices of shares or share price-indices (e.g. the DowJones index), prices of commodities (e.g. the price of gold), foreign exchange rates (e.g. the EUR/USD rate), specific reference interest rates (e.g. the 3-months LIBOR rate as in a certain currency), or an entire yield curve (e.g. the US Treasury Curve). It is important to notice that a yield curve itself is a multi-dimensional object often referred to as the interest term structure as it represents a collection of reference rates with different tenors or maturities.Footnote 2 Hence, because a single risk factor can represent a vector-valued object, we need to introduce a third dimension in the representation of a single risk factor scenario. The other two dimensions are the risk factors themselves and the simulation time.
Since individual risk factor scenarios are independent of each other, we can transform them into a data structure where the rows are also independent from each other (see Fig. 3, top-right box) with the following dimensions:
-
i.
The risk factor scenarios (rows);
-
ii.
The risk factors that constitute the risk factor model (nested columns);
-
iii.
Simulation time (nested rows);
-
iv.
An additional grouping of risk factor components into vector-valued risk factor objects (separate meta-data file, see column RF-meta in box on bottom of Fig. 3).
Hence, to meet the requirement of the Spark parallel computation environment, we had to map this structure onto a risk factor table where each row contains a structured data object with the entire data for a single risk factor scenario.
The computation must be carried out for all the pairwise combinations of all rows of the contract data table with all rows of the risk factor table. Such a joint contract–risk factor input table can be produced by means of a Cartesian product (see bottom part of Fig. 3).
Since both the contracts and the risk factor scenarios are independent from each other, the elements of the product table are also independent from each other. As a result, we can compute the cash flows for different contract–risk factor combinations (see bottom part of Fig. 3) independently.
The re-organization of the input data has the additional advantage that the existing computational kernels can be used for the parallel execution with minimal modifications, only.

Financial analytics data structures. The top part shows the data structures of the two main data input data sets, i.e. contracts and risk factors. The lower part shows the joined contract–risk factor input table where each row is an independent combination of contract and risk factor information. Since all rows are independent from each other, we can easily parallelize the calculation of the resulting cash flows
Methods: system design
In this section, we describe the Big Data architecture that enables large-scale financial risk modeling. In particular, we present two different approaches. Approach 1 is called On-the-fly-architecture and performs end-to-end financial processing without materializing intermediate results. Approach 2 is called Materialized-Architecture and materializes intermediate results to enable interactive analytics based on pre-calculated data—an approach that is common in data warehousing [34]. We will motivate the design decisions for both approaches and discuss advantages and disadvantages. In "Detailed design of parallel data flows" section, we provide detailed design decisions for a parallel data flow implementation that leverages both Spark User-Defined Functions as well as Spark SQL to implement linear, financial analytics at scale.
High-level big data architecture
The financial use case presented in "Background" section allows for two different modes of analysis, namely On-the-fly analysis without the need to materialize large amounts of intermediate cash flow results, and time-deferred analysis where these intermediate results are materialized in order to be available for later analysis. The architectures for these analytical modes are displayed in Fig. 4. Panels (a) and (b) show two variations of the On-the-fly architecture while the architecture for time-deferred analysis is depicted in panel (c). We have implemented these architectures with Apache Spark using Amazon’s S3 file system.Footnote 3
On-the-fly-architecture
Figure 4a, b show the On-the-Fly architecture of our system. More specifically, the architecture sketched in panel (a) uses UDFs for performing both the non-linear and linear analytics while the architecture sketched in panel (b) uses UDFs for the non-linear analytics and Spark SQL for the linear analytics.
Notice that both architecture scenarios use the ACTUS simulation kernel for the computation of the cash flow events (complex, non-linear analytics) and both do not materialize these intermediate results but perform financial analytics right away in the same Spark context.
As to Question 1 of "Research objectives" section concerning the ease of parallelizing existing computational kernels, we note the following: The UDF-approach has the advantage that the existing Financial Analysis Kernel can be reused for parallel computation without major rewrites. Only the core data structure of ACTUS needs to be re-written as a Spark Dataset containing the joint contract–risk factor input table (see Fig. 3) in order to fully benefit from Spark’s parallel computing engine. Subsequently, all financial calculations must also be performed on Spark Datasets.
Spark SQL provides an alternative to the “out-of-the-box” approach of UDFs. Since the Financial Analysis Kernel (that is used to perform financial analytics based on cash flows) consists entirely of linear transformations, at least some of its functionality can very naturally be expressed in SQL. We thus expect the processing to benefit from Spark Catalyst, i.e. Spark’s SQL Query Optimizer [21], to significantly improve run time performance. In order to test this hypothesis, we compute the analytical quantities (2)–(4) introduced in "Financial analytics as linear transformations" section both with UDFs and SQL statements and compare their performance in "Results and discussion" section.
Materialized architecture
Materializing intermediate results is common practice in data warehousing where dedicated data marts use intensive materialization to speed up query processing. However, materialization is often a trade-off between query speed and storage consumption since materializing results can significantly increase the storage requirements depending on the specific problem [34]. Moreover, materialized results might be out-of-date when the underlying calculations change. This applies one-to-one to our use case where materialization would allow flexible analysis according to ad-hoc criteria.
Figure 4c shows the architecture where intermediate results are materialized and can be reused for subsequent analytics or query processing. The simulation step that required complex, non-linear analytics remains unchanged. However, as opposed to the On-the-fly architecture, here we materialize the simulation results on AWS S3 in Parquet format. In a subsequent analytical step, a second Spark context performs financial analytics (see “Spark Context 2” in Fig. 4c) either with UDFs or SQL as previously shown in the On-the-fly architecture.
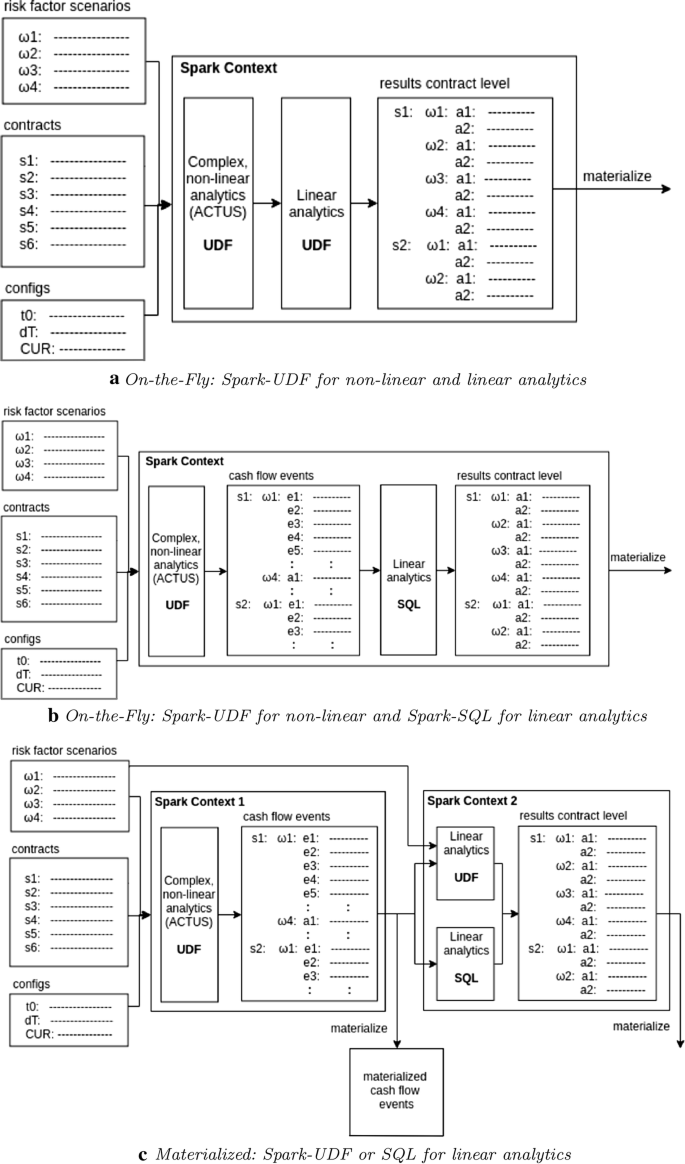
Big Data Architecture using three inputs: contracts, risk factors and analytical configuration parameters. The (non-linear) simulation step is carried out using Spark UDFs. The (linear) analytical steps are performed using a UDFs, b SQL and c UDFs or SQL
Detailed design of parallel data flows
Let us now turn to the detailed design of parallel data flows of the whole APFA to implement complex financial calculations. First, we discuss the design based on Spark User-Defined Functions for the implementation of the whole ACTUS process of financial analysis. Second, we discuss the design based on Spark SQL, which requires rewriting Eqs. 2–4 but enables leveraging Spark SQL’s Query Optimizer for linear financial analytics.
On-the-fly-architecture: spark user-defined functions
Figure 4a shows the data flow for the On-the-fly processing based on Spark-UDFs for financial analytics. The two main input data sets are the risk factor scenarios and the financial contracts, from which the contract–risk factor input table is produced. All resulting contract–risk factor pairs need additional inputs such as time-period specification for liquidity aggregation and reporting currency. After the cash flows being calculated, the financial analytics is performed, which yields contract-level results.
The main advantage of this approach is that the non-linear simulation part and the linear analytics can both be performed by the existing computation kernels. Parallel data processing is achieved through leveraging UDFs in Spark.
On-the-fly-architecture: Spark SQL
Figure 4b shows the data flow for the On-the-fly processing using SQL for the analytical part. The simulation part remains unchanged. Now, however, the cash flow events are kept in (distributed) main memory and the analytical part is performed using Spark SQL to express Eqs. 2–4. The hypothesis is that the performance of these types of calculations can benefit from the Spark’s Query Optimizer.
Materialized architecture: Spark UDF and SQL
Last, the same two implementations of financial analytics, i.e. the Spark UDF and Spark SQL approach, are applied also to the materialized cash flow events. Figure 4c shows the detailed data flows for the materialized architecture with cash flow event generation as first step in Spark Context 1 and analytics computations using Spark UDFs or Spark SQL as second step in Spark Context 2.
Results and discussion
In this section, we will describe the experimental setup used for the performance evaluation of our system on up to 512 vCPU cores and present the results. In particular, we will analyze the performance difference between the on-the-fly architecture and the materialized architecture. Moreover, we will study how the UDF-based approach differs from a SQL-based approach and in which case the financial calculations can benefit from Spark’s SQL Query Optimizer.
Our performance evaluation demonstrates almost linear scalability for the best design choice. The results show that UDFs perform better for complex queries while SQL performs better for less complex queries.
Experimental setup
The ACTUS Simulation Kernel is implemented in Java. In order to parallelize the execution of the calculations, we used Apache Spark [35]. All experiments were executed on Amazon Web Services running Spark 2.3 using the Java interface of Spark and ACTUS.
We used up to 32 machines of type m3.2\(\times\)large, each with 30 GB RAM and 16 vCPU cores running at 2.5 GHz. In total, the largest experiments ran on 960 GB of (distributed) RAM and 512 vCPU cores. In order to achieve maximum elasticity, we used Amazon’s S3 file system [36] running in the same data center (us-east-1) that also runs Amazon Web Services hosting Spark. Further, we extended AWS’s standard Spark and YARN configuration for the experiments according Cloudera’s best practices [37]. To achieve the maximal parallelism, each machine is configured with three Spark executors running on 5 CPU cores and 6.5 GB of RAM.
Our test case contains up to 96 million financial contracts that need 40 ACTUS contract attributes for input specification for the simulation and 3 additional parameters for the analytical part. The contracts represent both fixed-rate and variable rate bullet loans and are simulated randomly for this study. The total size of the contract data set is 30 GB. In addition, we generated up to 1,000 risk factor scenarios that have a total size of 3 MB. Note that the two input data sets per se are relatively small. However, when performing the Cartesian product that serves as the input for the event calculations, the resulting data set is of the order of 300 GB for 1 risk factor scenario and 96 million contracts. The simulation results, on the other hand, consist of an event stream for each contract–risk factor pair, which results in a maximum file size of about 450 GB again for 96 million contracts and 1 risk factor scenario.Footnote 4
Financial simulation and analytics
In all cases, the financial simulation is carried out by the ACTUS Simulation Kernel, which implements Eq. 1. We emphasize again that this is the non-linear part of the whole process.
As to the linear, analytical part, we evaluated nominal value (Eq. 2), liquidity (Eq. 4) and fair value (Eq. 3), which are all provided by the Financial Analysis Kernel as UDFs and re-written in SQL.
Nominal value is straightforward and results in the following simple SQL query:

where AD0 refers to the initial event of cash flows.
Liquidity is more complex, since it depends not only on the cash flows but also requires a varying number of time periods of variable length (see Eq. 4). Every additional time period results in a further UNION-path which increases the complexity of the SQL query. The following query shows a liquidity calculation over 2 time periods:

Fair value is the most complex calculation when expressed in SQL. These types of analytics require discount factors, which are computed from the yield-curves of the risk factor data. This computation requires the extraction of data for various tenors and typically also interpolation because cash flows mostly do not occur exactly at the tenor dates. While technically possible, such operations result in overly complex SQL queries and considerable amount of re-writing. Hence we did not attempt to re-write that part of the Financial Analysis Kernel in SQL so that Fair Value analytics is available only as Spark-UDF and not in SQL.
On-the-fly results
The objective of these experiments is to address Questions 2 and 3 stated in "Research objectives" section. In short, the goal is to measure the performance of parallel financial analytics based on UDFs (where the existing financial kernel can be re-used) as opposed to re-writing the linear analytics in SQL in order to take advantage of Spark’s Query Optimizer. Moreover, for the first set of experiments we evaluated the end-to-end runtime without materializing intermediate results.
For all our experiments we studied the scalability by simultaneously increasing the number of CPU cores and the size of the input data set. For instance, when doubling the number of CPU cores, we also doubled the size of the input data set. This type of scalability evaluation is also referred as Gustafson–Barsis’s Law in parallel computing [38]. The advantage of this approach is that the performance can easily be interpreted since the ideal performance curve is a parallel to the x-axis (line with slope 0).
Figure 5 shows the performance of the simulation step (together with a “trivial” analytics consisting simply of counting the cash flow events) on up to 512 vCPU cores (see label of x-axis at the bottom) and up to 96 million contracts (see label of x-axis at the top). The results described here and in the remainder of the paper are for a combination of a certain number of contracts (top x-axis) and 1 risk factor scenario. Other experiments have shown the same scaling behavior for different combinations of contracts and risk factor scenarios. In other words, the analysis scales similarly in contracts and in risk factor scenarios so that for the scaling behavior of execution time vs. input size, the number of contract–risk factor scenario pairs is the only quantity of interest.
We can see that from 16 vCPU cores (which corresponds to 1 Spark worker node) to 32 vCPU cores (2 nodes), the slope of the curve is larger than 0, which indicates sub-optimal performance. The reason is that by increasing the number of nodes from 1 to 2, Spark needs to start the cluster management, which includes shuffling of data over the network and causes an extra overhead. However, starting from 32 cores we observe almost linear scalability with a slope close to 0. Since there is no additional disproportional management overhead in our application, this is the expected behavior.

Generation and count of the number of cash flow events for various combinations of contracts and risk factor scenarios. Note the two x-axes. The top part shows the number of contractions while the bottom part shows the number of vCPU cores. In short, as we double the number of vCPU cores, we also double the input data size
Figure 6 shows the performance for calculating nominal value, liquidity and fair value based on UDFs and SQL running on up to 512 vCPU cores. Notice that the calculations include the simulation step. Let us first analyze the results for UDFs. All three curves look similar to the curve of counting cash flow events. These results show that linear financial analytics calculations do not introduce any unexpected scalability issues when compared with counting cash flow events. Most time is spent on the simulation part.Footnote 5
We also notice that calculating liquidity takes significantly longer than calculating nominal value, which is due to the additional complexity of temporal query processing. We will analyze this aspect in more detail in Fig. 7 below.

UDF and SQL analytics for on the On-the-fly-architecture to calculate nominal value, liquidity and fair value
Let us now analyze the performance of executing linear financial analytics with Spark SQL (see again Fig. 6). The main goal of these experiments is to study if these types of calculations can benefit from Spark’s SQL Query Optimizer. The results shows that this is clearly not the case. While the execution time for event counting and nominal value are very similar to the results obtained before, the execution time for liquidity calculation has doubled. In addition, it could be carried out only with up to 64 cores and then crashes because it exceeds the memory limits of the system even though the size of the intermediate cash flow event table (CFET) requires only approximately half of the system’s total memory.
This disappointing behavior is caused by the structure of Eq. 4. The computation involves a summation of cash flow events within different time periods of different lengths.
Since Spark does not support temporal SQL functionality, every time period needs to be calculated on its own and later added to the result with a union. That means that (i) the CFET must be accessed multiple times, (ii) large intermediate result sets are created and (iii) the latter must be updated for every time window. These operations consume a large amount of the main memory for shuffling, repartitioning and memorizing intermediate results, which eventually causes the application to crash.
Let us now focus on the liquidity calculations which use up the longest computation time. In order to better understand the performance of the liquidity analytics, we ran experiments with different liquidity time periods ranging from 1 to 16 (see Fig. 7). We can see that as the number of time periods increases, the execution times for both UDF- and SQL-based analytics increase. However, we notice a higher increase of the SQL execution times. The reason for this increase is that each additional liquidity period requires additional calculations over the contract data and hence increases the complexity of the calculation.

Increasing complexity of the liquidity analysis running on the On-the-fly-architecture. Liquidity is calculated ranging between 1 and 16 time periods with UDFs and SQL
Materialized results
The goal of these experiments is to measure the performance difference of running linear financial analytics based on UDFs vs. SQL when materializing large intermediate results.
The major challenge in our case is that the intermediate results of generated cash flow events are orders of magnitudes larger than the input data (i.e. the financial contracts and the risk factor scenarios). Hence, result materialization is a trade-off between storage consumption and CPU consumption.
Our first set of experiments shows the performance of generating and materializing cash flow events on Amazon’s S3 storage for up to 96 million contracts using up to 512 CPU cores (see Fig. 8). The size of the generated cash flow events ranges between 13.6 and 435.2 GB. We can observe a slope of 0.075. For optimal scalability, we would expect a slope close to 0. This positive slope is caused by the overhead incurred by creating Parquet files and updating the respective metadata information. Notice that the latter is performed by a single driver process, which requires expensive synchronization operations with all worker processes and thus cannot be expected to scale perfectly.

Generating and materializing cash flow events on AWS to an S3 bucket
As to linear financial analytics, on the other hand, the results in Fig. 9 show clearly a performance advantage for Spark SQL with respect to UDF. The reason is that UDFs are a black box for the Spark Query Optimizer so that Spark needs to load all data from the Amazon S3-bucket when calculating analytics with UDFs.
Moreover, preparing the data for subsequent financial analytics requires memory-intensive shuffling operations. These expensive operations in combination with the limited repartition options of Spark cause the crash of our application due to exceeding the system’s memory limits. In the SQL approach, on the other hand, Spark fully takes advantage of the Query Optimizer so that it loads only the requested rows and benefits from optimization techniques such as column pruning and filter pushdown [21].

UDF and SQL analytics on the materialized architecture to calculate nominal value, liquidity and fair value
Finally, we analyzed the performance for liquidity analytics with different time periods. Figure 10 gives a quite detailed picture of the performance advantage of SQL: With an increasing number of time periods the performance advantage of SQL over UDFs decreases such that for more than 32 liquidity periods, UDF analytics performs slightly better than SQL analytics. Here again, the reason seems to be that Spark SQL’s Query Optimizer does not support temporal SQL processing efficiently so that it ends up with ever more complex queries for increasing number of time periods.
In summary, when using the materialized architecture the results show a clear advantage of performing linear financial analytics using Spark SQL over UDFs. However, when time-series specific operations of increasing length must be carried out, this performance advantage continuously decreases and eventually vanishes.

Increasing complexity of the liquidity analysis running on the materialized architecture. Liquidity is calculated ranging between 1 and 16 time periods with UDFs and SQL
Conclusion
In this paper we presented the implementation of a real-world use case for performing large-scale financial analytics. We investigated the performance of two different parallel implementations based on existing computation kernels. Approach 1 uses Spark UDFs for parallel query processing. This approach has the benefit that the existing computation kernel only requires minimal re-writing to take advantage of Spark’s parallel computing environment. Approach 2 uses Spark SQL that requires complete re-writing of the respective linear financial analytics in order to take advantage of Spark’s SQL Query Optimizer. Moreover, we measured the performance of these two approaches on an On-the-fly-architecture and compared the results against a Materialized-architecture. In our experiments on up to 512 vCPUs cores the financial analytics based on UDFs shows good scalability for a real-world use case while SQL-based analytics deteriorate for certain, more complex query workloads. However, performing analytics on Spark SQL shows advantages for iterative workloads on materialized results.
Based on our experience with using Spark in the context of financial analytics in a real-world use case, we learned the following lessons that also provide answers to the research objectives that we introduced in "Research objectives" section.
Lesson 1—Use UDFs for on-the fly calculations: UDFs can leverage an existing financial analysis kernel and perform significantly better than re-writing the respective function in SQL —even though SQL is well adapted to linear operations. The reason is that even though Spark’s Query Optimizer produces reasonable query plans, the financial calculations contain temporal query aspects that are not especially supported because temporal SQL is missing in Spark. Given that many financial calculations require some form of temporal query processing, implementing temporal SQL in Spark would be crucial for this type of applications.
Lesson 2—Use SQL for iterative calculations on materialized results: Spark SQL can take advantage of the query optimizer for certain financial calculations based on materialized results. The advantage over UDFs can be seen when processing is iterative and queries do not contain complex, temporal query aspects. But also in this case, the lack of a temporal query optimizer becomes painfully apparent.
Lesson 3—Performance tuning of Spark on real-world problems remains challenging: The query plans for complex analytics cause memory issues that require manual intervention or do not successfully terminate at all —which is in stark contrast to expectations of dynamic memory management. Hence, detailed performance analysis of the workloads and manual optimization techniques such as task repartitioning based on work load characteristics is often the best solution to overcome Spark’s memory management problems.
In the following we give an outlook of a research agenda to make the computations presented in this paper even more efficient.
-
Since nearly all financial analytics makes use of time-related operations in one form or the other, the implementation of temporal SQL in Spark seems to us of utmost priority. Ideally it should be based on the definition of general time series operators. A more adequate name may be Time Series SQL, which should support all operators used in common time series models such as Autoregressive Model, Moving-Average Model, Generalized Autoregressive Conditional Heteroscedasticity and combinations thereof.
-
Another useful innovation would be the extension of SQL such that the contract algorithms, i.e., the (non-linear) simulation step described in Eq. (1), could be expressed directly in SQL. Since financial contracts are pervasive in the financial industry and all analytics is eventually based on cash flows as input, such an extension would contribute to the diffusion of the contract-based simulation and analysis techniques and thus be a contribution to increased efficiency and transparency of financial analysis. We are inclined to call this extension Financial Contract SQL.
-
Another element missing in SQL is the ability to automatically evaluate net present value by summing up the discounted cash flows. This would require a combination of time series operations already discussed (which should include, among others, weighed moving average operators) and the evaluation of the discount factors from yield curves provided as input. The latter is another extension that in our view is fundamental for SQL-based automated financial analytics.
-
One of the advantages of the previously mentioned SQL extensions would be the possibility of automated query optimization, which is possible because of the declarative nature of SQL. This is similar as in the case of multi-query optimization. In our example, each financial calculation can be considered as a query. Since different financial calculations are based on the same data sets, there is a considerable opportunity for optimization that have not taking into account yet, since we treated all calculations as independent operations.
-
In this work we have focused on the Spark platform for Big Data computations and have found almost optimal scalability characteristics for existing financial kernels. It would be interesting to compare these results with the performance achieved on other platforms such as Flink,Footnote 6 Drill,Footnote 7 Impala,Footnote 8 or Presto.Footnote 9 In particular, the financial analytics and research community could profit from insights into the stability of memory management for these other platforms and whether they run into similar issues when executing complex queries as summarized under Lesson 3 above.
We believe that the extensions sketched above are innovations that will be beneficial for the automation of the analytics in the whole financial industry and thus will have widespread applications and impact.
Availability of data and materials
Not applicable.
Notes
Currently, the highest time resolution is one day.
For instance, the US Treasury Curve is composed of the 1-month, 2-months, 3-months, 6-months, 1-years, 2-years, 3-years, 5-years, 7-years, 10-years, 20-years, and 30-years tenor according to [33].
The maximum number of contracts computable by a single node are 3 million contract–risk factor pairs for the on-the-fly SQL approach. A higher number of contracts causes Spark memory problems. The reason for this behavior will be discussed in "On-the-fly results" section. We used that number as an upper calculation load limit per node. So we result in 96 million contract–risk factor pairs on 32 nodes for our largest test case.
Surprisingly, calculating nominal value is even faster than counting the events. This counterintuitive behavior is due to the architecture of the application. For counting all events, these events (Java objects) must be loaded into main memory as a Spark Dataset. On the other hand, for calculating nominal value, the events of any contract are analyzed directly after their generation and only a single value per contract–risk factor input is loaded into the Spark Dataset. In summary, summing up the individual nominal values generates less overhead than loading all events into a Spark Dataset—which requires a costly conversion from Java objects to Spark Datasets.
Abbreviations
- ABS:
-
asset backed securities
- ACTUS:
-
Algorithmic Contract Type Unified Standard
- APFA:
-
ACTUS process of financial analysis
- AWS:
-
Amazon Web Services
- BCBS:
-
Basel Committee on Banking Supervision
- CDO:
-
collateralized debt obligations
- CFET:
-
ash flow event table
- UDF:
-
user-defined functions
References
UBS AG. Shareholder report on write-downs. http://maths-fi.com/ubs-shareholder-report.pdf.
Basel Committee on Banking Supervision. Principles for effective risk aggregation and risk reporting. 2013.
Enterprise Data Management Council. FIBO Primer. 2018.
Actus Financial Research Foundation. Algorithmic contract type unified standards. https://actusfrf.org.
Brammertz W, Akkizidis I, Breymann W, Entin R, Rustmann M. Unified financial analysis. Chichester: Wiley; 2009.
Csermely P, London A, Wu L-Y, Uzzi B. Structure and dynamics of core/periphery networks. J Compl Netw. 2013;1(2):93–123.
Jenkinson N, Leonova IS. The importance of data quality for effective financial stability policies- Legal entity identifier: a first step towards necessary financial data reforms. Financ Stab Rev. 2013;17:101–10.
Wilkinson B, Allen M. Parallel programming—techniques and applications using networked workstations and parallel computers. 2nd ed. New Jersey: Prentice Hall; 2005.
Stockinger K, Heitz J, Bundi N, Breymann W. Large-scale data-driven financial risk modeling using big data technology. In: International conference on Big Data computing, applications and technologies. 2018.
Fang B, Zhang P. Big data in finance., Big Data concepts, theories, and applicationsBerlin: Springer; 2016. p. 391–412.
Seth T, Chaudhary V. Big data in finance., Big Data: algorithms, analytics, and applicationsBoca Raton: CRC Press; 2015.
Einav L, Levin J. The data revolution and economic analysis, vol. 14., Innovation policy and the economyCambridge: National Bureau of Economic Research, Inc; 2013. p. 1–24.
Varian HR. Big Data: new tricks for econometrics. J Econ Persp. 2014;28(2):3–27.
Hassani H, Silva ES. Forecasting with Big Data: a review. Ann Data Sci. 2015;2(1):5–19.
Chen J, Tao Y, Wang H, Chen T. Big data based fraud risk management at alibaba. J Financ Data Sci. 2015;1(1):1–10. https://doi.org/10.1016/j.jfds.2015.03.001.
Srivastava U, Gopalkrishnan S. Impact of big data analytics on banking sector: learning for indian banks. Proc Comput Sci. 2015;50:643–52. https://doi.org/10.1016/j.procs.2015.04.098 Big Data, Cloud and Computing Challenges.
Gepp A, Linnenluecke M, O’Neill T, Smith T. Big data in accounting and finance: a review of influential publications and a research agenda. J Account Lit. 2018;40:102–15.
Cerchiello P, Giudici P. Big data analysis for financial risk management. J Big Data. 2016;3:18.
Corea F. Big data and risk management in financial markets: a survey. Montreal Institute of Structured Finance and Derivatives April: Technical report; 2016.
Zaharia M, Chowdhury M, Das T, Dave A, Ma J, McCauley M, Franklin MJ, Shenker S, Stoica I. Resilient distributed datasets: A fault-tolerant abstraction for in-memory cluster computing. In: Proceedings of the 9th USENIX conference on networked systems design and implementation. USENIX Association. 2012, p. 2.
Armbrust M, Das T, Davidson A, Ghodsi A, Or A, Rosen J, Stoica I, Wendell P, Xin R, Zaharia M. Scaling spark in the real world: performance and usability. Proc VLDB Endow. 2015;8(12):1840–3.
Carbone P, Katsifodimos A, Ewen S, Markl V, Haridi S, Tzoumas K. Apache flink: stream and batch processing in a single engine. Bull IEEE Comput Soc Tech Comm Data Eng. 2015;36:4.
Shi J, Qiu Y, Minhas UF, Jiao L, Wang C, Reinwald B, Özcan F. Clash of the titans: mapreduce vs. spark for large scale data analytics. Proc VLDB Endow. 2015;8(13):2110–21.
Silva V, Leite J, Camata JJ, De Oliveira D, Coutinho AL, Valduriez P, Mattoso M. Raw data queries during data-intensive parallel workflow execution. Fut Gener Comput Syst. 2017;75:402–22.
Nothaft FA, Massie M, Danford T, Zhang Z, Laserson U, Yeksigian C, Kottalam J, Ahuja A, Hammerbacher J, Linderman M, et al: Rethinking data-intensive science using scalable analytics systems. In: Proceedings of the 2015 ACM SIGMOD international conference on management of data. ACM. 2015, p. 631–46.
Sima A-C, Stockinger K, Affolter K, Braschler M, Monte P, Kaiser L. A hybrid approach for alarm verification using stream processing, machine learning and text analytics. In: International conference on extending database technology (EDBT). ACM. 2018
Salloum S, Dautov R, Chen X, Peng PX, Huang JZ. Big data analytics on apache spark. Int J Data Sci Anal. 2016;1(3–4):145–64.
Ariadne Business Analytics AG. Ariadne analytic platform. https://ariadne.swiss.
Kavassalis P, Stieber H, Breymann W, Saxton K, Gross FJ. An innovative regtech approach to financial risk monitoring and supervisory reporting. J Risk Financ. 2018;19(1):39–55.
Breymann W, Bundi NA, Heitz J, Micheler J, Stockinger K. Large-scale data-driven financial risk assessment. Appl Data Sci. 2019.
Subhlok J, Stichnoth JM, O’hallaron DR, Gross T. Exploiting task and data parallelism on a multicomputer. In: ACM SIGPLAN Notices, vol. 28. ACM. 1993, p. 13–22.
Kambatla K, Kollias G, Kumar V, Grama A. Trends in big data analytics. J Parall Distrib Comput. 2014;74(7):2561–73.
US Department of the Treasury. Daily treasury yield curve rates. https://www.treasury.gov/resource-center/data-chart-center/interest-rates/Pages/TextView.aspx?data=yield.
Yang J, Karlapalem K, Li Q. Algorithms for materialized view design in data warehousing environment. VLDB. 1997;97:25–9.
Zaharia M, Xin RS, Wendell P, Das T, Armbrust M, Dave A, Meng X, Rosen J, Venkataraman S, Franklin MJ, et al. Apache spark: a unified engine for big data processing. Commun ACM. 2016;59(11):56–65.
Xin R, Rosen J, Pistor K. Top 5 reasons for choosing S3 over HDFS—the Databricks Blog. Databricks. 2017. https://databricks.com/blog/2017/05/31/top-5-reasons-for-choosing-s3-over-hdfs.html
Ryza S. How-to: tune your Apache Spark Jobs (Part 2). Cloudera. 2015. http://blog.cloudera.com/blog/2015/03/how-to-tune-your-apache-spark-jobs-part-2/
Czech ZJ Introduction to parallel computing. 2016, p. 70–1.
Acknowledgements
We want to thank our colleagues from the DatFRisMo-project, Ariadne Business Analytics AG and Fintegral Schweiz AG, for fruitful discussions and comments about the framework. Furthermore, we are grateful to the reviewers for their important feedback and constructive critique of this work.
Funding
The work was supported by the Swiss Commission for Technology and Innovation (CTI) under grant 25349.1 PFES-ES.
Author information
Authors and Affiliations
Contributions
WB and KS provided the conceptional framework for the system. NB and JH implemented the framework and ran the experiments. All authors contributed to writing the paper. All authors read and approved the final manuscript.
Corresponding author
Ethics declarations
Competing interests
The authors declare that they have no competing interests.
Rights and permissions
Open Access This article is distributed under the terms of the Creative Commons Attribution 4.0 International License (http://creativecommons.org/licenses/by/4.0/), which permits unrestricted use, distribution, and reproduction in any medium, provided you give appropriate credit to the original author(s) and the source, provide a link to the Creative Commons license, and indicate if changes were made.
About this article

Cite this article
Stockinger, K., Bundi, N., Heitz, J. et al. Scalable architecture for Big Data financial analytics: user-defined functions vs. SQL. J Big Data 6, 46 (2019). https://doi.org/10.1186/s40537-019-0209-0
Received:
Accepted:
Published:
DOI: https://doi.org/10.1186/s40537-019-0209-0