- Research
- Open access
- Published:
An approach to application-layer DoS detection
Journal of Big Data volume 10, Article number: 22 (2023)
Abstract
With the massive resources and strategies accessible to attackers, countering Denial of Service (DoS) attacks is getting increasingly difficult. One of these techniques is application-layer DoS. Due to these challenges, network security has become increasingly more challenging to ensure. Hypertext Transfer Protocol (HTTP), Domain Name Service (DNS), Simple Mail Transfer Protocol (SMTP), and other application protocols have had increased attacks over the past several years. It is common for application-layer attacks to concentrate on these protocols because attackers can exploit some weaknesses. Flood and “low and slow” attacks are examples of application-layer attacks. They target weaknesses in HTTP, the most extensively used application-layer protocol on the Internet. Our experiment proposes a generalized detection approach to identify features for application-layer DoS attacks that is not specific to a single slow DoS attack. We combine four application-layer DoS attack datasets: Slow Read, HTTP POST, Slowloris, and Apache Range Header. We perform a feature-scaling technique that applies a normalization filter to the combined dataset. We perform a feature extraction technique, Principal Component Analysis (PCA), on the combined dataset to reduce dimensionality. We examine ways to enhance machine learning techniques for detecting slow application-layer DoS attacks that employ these methodologies. The machine learners effectively identify multiple slow DoS attacks, according to our findings. The experiment shows that classifiers are good predictors when combined with our selected Netflow characteristics and feature selection techniques.
Introduction
Network cyber-attacks have become commonplace in today’s world. These attacks have become very sophisticated and challenging to prevent. Many stealthier attacks target the application layer, where they take advantage of vulnerabilities in web servers [1]. Because web servers are open to the public, they are accessed frequently by many users. The attackers’ goal is to simulate legitimate, normal traffic as closely as possible, which they do well. The task for those defending the networks is to determine the difference between normal and attack traffic. Making it even more of a challenge, the attackers are constantly updating their attack methods. One approach to assisting network security personnel is machine learning. Networks have enormous amounts of data they collect. The data comes from various sources, such as logs, Full Packet Captures (FPCs), and Netflow traffic. Machine learning can use data from these sources as input for machine learning algorithms. Also, algorithms have many options that can optimize that algorithm for a given scenario.
Additionally, there are techniques used to enhance the data before the machine learning algorithm is applied. After collecting the data, the next step is data cleansing, followed by the machine learning process. Selecting the most relevant attributes, commonly referred to as features, generally improves the machine learner’s performance. One must keep in mind that a set of features that perform well with one machine learner may not perform well with another machine learner. Discovering the correct set of features for machine learning is referred to as feature selection. The goal of feature selection is to determine characteristics that will produce the best accuracy and predictability for the machine learner. Network attacks come in many varieties, each of which operates at different layers, with slow Denial of Service (DoS) attacks operating at the application layer as shown in Fig. 1. Our work concentrates on multiple application-layer DoS attacks in this study. User applications receive network services from the application layer. Protocols that operate with user data are known as network services. At the application level, web browsers rely on the Hypertext Transfer Protocol (HTTP) protocol to compress data sent to and received from a web page.

Slow DoS at the application layer
In recent years, DoS attacks targeting application protocols have been on the rise [2]. HTTP, Domain Name Service (DNS), Simple Mail Transfer Protocol (SMTP), and other application protocols have increased attacks over the past several years. It is common for application-layer attacks to concentrate on these protocols because attackers can exploit some weaknesses [3]. Attacks targeting application resources can take various forms, such as HTTP GET, HTTP POST, Slow Read, and Apache Header attacks. The HTTP protocol contains weaknesses that attackers exploit when employing low-level and slow-moving tactics. A low-and-slow attack targets application or server resources with a modest stream of persistent traffic. Low and slow assaults, unlike more standard brute-force attacks, need extremely little bandwidth. They can be difficult to counter since their attack traffic blends in nicely with normal traffic, making it impossible to discern between the two.
To circumvent intrusion detection systems, attackers employ a variety of evasion techniques that expose the network’s DoS vulnerabilities. Evasive DoS techniques will secretly affect ordinary online services without causing any alarms. The use of flow-based (Netflow) analysis is one such option. Netflow, often known as session data, is a high-level representation of network traffic. A conversation is represented by a five-attribute network flow record. The IP addresses for the source and destination, as well as the source and destination ports, are listed first, followed by the transport protocol [4]. The System for Internet-Level Knowledge (SiLK) [5] is a collection of Netflow session data generation and analysis tools. SiLK is capable of collecting Netflow data as well as converting FPCs to Netflow. Netflow consumes a disproportionately smaller amount of storage than FPCs. Due to the smaller size, it is possible to parse flows quickly and effectively without requiring a lot of CPU power. Netflow is critical when it comes to server memory and hard disk requirements. Netflow also makes use of well-designed features to prevent attackers from using evasion techniques [6].
In this study, we made three distinct contributions. The first involves examining multiple application-layer DoS attacks using Netflow features and machine learning predictive models to detect them. Predictive models are built using these features with six learners to detect evasive, slow application-layer DoS attempts. The six machine learning approaches are: Random Forest (RF), C4.5D and C4.5N decision trees, 5-Nearest Neighbors (5NN), Naive Bayes (NB), and JRip, which uses repeated incremental pruning to reduce errors. Based on our previous experience with network data and its diversity, we selected these classifiers. The six machine learners provided us with a diverse set of algorithms to integrate with our Netflow features. The Netflow features take advantage of the Internet Protocol Flow Information Export (IPFIX) [7] protocol’s scalability and adaptability to a variety of scenarios.
The integrity of our data is the subject of our second contribution. Other studies have gathered data through the use of simulations, testbeds, and software-generated traffic [8, 9]. We get data from a production computer network’s real-world network. Regular traffic aids in the representation of outcomes in a live network context. Attacks were produced on a functional, live platform. We created four application-layer DoS assaults by modifying variables in each attack utilizing three tiers of concurrent connections, giving us a broad range of attacks with represented models that mirror real-world behavior. Because we provide our data in a live setting rather than simulated environments or testbeds, we can demonstrate its quality and integrity. When collecting data on a live network, there are a few obstacles to overcome. The creation of sufficient normal data, the concern for information privacy, the implementation of attacks on a live network without disruption, computers required to attack at the same time, and network management are all challenges. Because of these difficulties, other related fields frequently rely on publicly available databases [10, 11].
Feature selection is our third contribution. We employ selective feature evaluation and investigate several methods used to specify the attribute evaluators and search methods. We evaluate the significance of a subset of attributes by a feature’s predictive ability and the amount of duplication between them. Highly correlated feature subsets with the class while having low intercorrelation are preferred. For this experiment, we chose the Weka [12] feature selection methods CfsSubsetEval, ConsistencySubsetEval, and ClassifierSubsetEval. We also used Weka functions for single-attribute evaluation, such as ChiSquaredAttributeEval, GainRatioAttributeEval, and Principal Component Analysis (PCA), which is a feature extraction technique. When combined with the Ranker search method, ChiSquaredAttributeEval and Gain-RatioAttributeEval rank individual characteristics according to their assessment. Unlike other single-attribute evaluators, PCA transforms the given set of attributes into newly created subsets of its own.
The highlights of our research are as follows:
-
Investigating DoS attack types using Netflow features and machine learning.
-
Using real-world network data to build intrusion detection datasets.
-
Showing that our models are good predictors of DoS attacks.
The following is how we ordered our paper. We go over standard slow application-layer attack methods, tools, and data types in “Background” section. In “Related works” section, we go over some of the other research that has been done on gathering and identifying delayed application-layer DoS HTTP attacks. Our data gathering techniques and experimental designs are described in “Experimental procedure” section. “Results” section is a discussion about our results, and “Conclusion” section is our conclusion and future work.
Background
There are a variety of methods for enacting an application-layer DoS attack. Contingent on the characteristics of the network, various types of attacks are chosen based on the targeted traffic. In this section, we detail the slow application-layer attacks, data collection process, and Netflow traffic.
Application-layer attack methods
DoS attacks are difficult to trace due to their evasive techniques. Attackers will impersonate IP addresses to mask their origin, making DoS tracking difficult. Furthermore, the number of attacks focusing on the application layer is expanding at an alarming rate. When deploying a comprehensive Distributed Denial of Service (DDoS) defense, it is important to understand all the aspects of the DDoS attack mechanism. Over the past several years, researchers have offered numerous types of DoS attacks in their work.
Unlike high-bandwidth flooding assaults [13], low-bandwidth application-layer attacks focus on staying below the radar to evade discovery. Application-layer attacks do not require a huge number of bots and can be carried out on a single computer. When compared to traditional flooding attacks [14], these attacks use less bandwidth. The network traffic seems to be valid when a web browser is used to create a connection to servers using HTTP request messages. The server will then accept the connection and respond to HTTP queries with HTTP response messages. It’s difficult to tell the difference between an attack and typical traffic, and it takes experience in the field.
HTTP POST or HTTP GET queries are popular methods used in attacks on the application layer, exhausting web servers’ resources. The routers assess the entire transmission to see whether there has been a sudden increase in the detection of DDoS flood attacks. After locating the problematic router or server, administrators take steps to remove the threat. Attackers increasingly target HTTP, DNS, and SMTP services. Some of these attacks can be successful as compared to others if they require fewer network connections.
Regular expression DoS or ReDoS attacks employ a specifically constructed message to exploit a flaw in a server-side software library. The flaw allows the server to spend its resources while computing a regular expression from user input or performing a sophisticated regular expression attack.
Hash collision attacks are designed to exploit common security flaws in Web application frameworks. Hash tables are created on application servers to index POST session parameters. When returning comparable hash values, application servers must manage hash collisions. Collision resolution operations consume additional CPU time, such as when an attacker submits a POST message with a high number of arguments in a hash collision DoS attack scenario. Collisions of a Hash DoS attacks are extremely successful and may be performed from just one machine, gradually depleting the resources of the server.
Slow application-layer DoS attacks focus on services and vulnerabilities, enabling the attack to cause a denial of service without being discovered. The attack is based on a short burst of traffic that targets application or server resources. Application-layer attacks performed with the Transmission Control Protocol (TCP) connection enable the attack through regular network traffic as a valid connection. TCP is a dependable protocol that checks for mistakes and assesses if packets have been received throughout the communication between two machines. By receiving the server’s response gradually and employing a short TCP window size, slow application-layer DoS attacks maintain an open line of connection. The TCP protocol’s Request for Comments (RFC) 1122 [15], in which the receiver advertises zero-byte windows. The sender does not need to provide any further data to keep the communication tunnel open. By activating a zero-byte connection window, the target has created a vulnerability for a slow application-layer DoS attack.
While large-scale DDoS assaults are more likely to be identified immediately, low and slow level attacks can go undetected for lengthy periods of time while denying or degrading service to legitimate customers. Customers who purchase products and require access to internet accounts at anytime of day expect networks to have fast and efficient accessibility for their daily operations. Because of the widespread reliance on this access in today’s networks, malevolent attackers have turned their attention to this type of server. DoS attacks are designed to prevent customers and employees from receiving services. The methods utilized in application-layer DDoS assaults are listed below.
HTTP flood attack
HTTP flood attacks are the most common DDoS attacks targeting application resources. These attacks look like normal HTTP GET or POST requests to a victim’s Web server, rendering them difficult to identify. HTTP flood attacks often include numerous computers (bots). These bots repeatedly request pages from the target site, triggering a DoS condition. The High Orbit Ion Cannon (HOIC) tool enables the execution of multi-threaded HTTP flood assaults in an easy-to-use manner.
HTTP GET requests attack
A malicious HTTP GET request monopolizes the server’s capabilities by using a large number of open connections. The available connections eliminate the requirement for services to consumers to establish authentic relationships. The attacker produces and transmits partial HTTP GET requests to the server, causing each connection request to be opened in a separate thread. The attacker transmits HTTP header data infrequently to ensure connections remain open and do not time out. Because the transmission occurs slowly, the server has to wait indefinitely, emptying the connection table and resulting in a DoS. HTTP GET-based attacks are easier to generate and can more efficiently scale in a botnet scenario.
Another attacking approach in this content is the Slowloris attack. The Slowloris attack bases itself on the weakness of an HTTP GET request. A delaying method is used in an HTTP GET header assault to alter timing. The attacker will not transmit all HTTP GET request headers concurrently, but rather divide and send each line separately. The server establishes communication with the malicious attacker and allots time for dialogue.
HTTP POST requests attack
Application-layer DoS attacks like Slowloris, Slow HTTP POST, Slow Read, and Apache Range Header drain the concurrent connections pool, leading the server to use a lot of memory and CPU. Most thread process-based HTTP servers (e.g., Apache) are vulnerable to this type of attack. Attackers can perform Slow HTTP POST attacks by issuing a lot of concurrent POST requests, and each of them will slowly send the POST body [16]. The attacker detects forms on the web server and sends HTTP POST requests to the web server via the forms and applies the Slow HTTP POST attack. Instead of being sent in bulk, POST requests are delivered one byte at a time. When an attacker sends a slow HTTP GET request, the attacker keeps the vulnerable connection open by progressively sending fresh bytes of POST data at regular intervals. Given the length of the HTTP POST request’s content, the server is forced to wait for the entire POST request to be received. The attacker repeats this activity in parallel, never closing a connection that is open. After several hundred connections are established, the target server becomes incapable of handling new requests, resulting in a DoS issue.
Apache range header attack
The Apache Range Header attack takes advantage of an Apache HTTP Server’s binary filter, allowing a malicious attack to launch a DoS attack through a range header expressing numerous intersecting scales [17]. A remote attacker can slow down or exhaust the resources of the service or server, rendering it incapable of responding to legitimate clients in a timely manner. The result of this vulnerability produces the result of a DoS. The server is unable to service any requests and refuses any additional connections. Using the SlowHTTPTest tool [18], a simple command generates a HEAD request with a header range of 0-, x-1, x-2, x-3, x-y where x is set by -a argument, y is set by -b argument and increments by 1 byte. The test works with various connection rates and numbers over Secure Sockets Layer (SSL).
Attack tools
This subsection briefly presents an overview of the primary attack tools used to execute application-layer attacks while staying under the radar. The development of specific attack tools focuses on performing attacks more efficiently and quickly.
The Orbit Ion Cannon is an offensive weapon available in two configurations: high and low. Both simplify the execution of multi-threaded HTTP flood assaults. Low Orbit Ion Cannon (LOIC) [19] can produce a substantial volume of TCP, User Datagram Protocol (UDP), or HTTP traffic that can overload a server and bring down a network. HOIC [20] is a software tool that leverages a simple Graphical User Interface (GUI) to inject HTTP POST and HTTP GET requests. An attacker can build Uniform Resource Locator (URL) lists and specify content for HOIC to traverse through as it produces DoS attacks by employing scripts. As a result, defending against these kinds of attacks becomes slightly more difficult. HTTP headers are transmitted to the destination server in tiny chunks.
R U Dead Yet (RUDY) [21] is a tool similar to Slowloris. RUDY launches a DoS attack by submitting HTTP POST requests using a field from the long-form field instead of HTTP headers injecting data into the POST field one byte at a time, resulting in a significant bottleneck of application threads. The long “Content-Length” field prevents the server from closing the connection. An attacker can create several connections when communicating with a server, eventually emptying the connection table, thus resulting in a DoS condition.
Botnets aid DDoS tools in launching attacks from a distributed network of computers. Whether there are hundreds, thousands, or millions of botnets, they dramatically increase the possibility of a DoS attack. Botnets are widely used by attackers. Botnets are massive networks of infected computers, frequently dubbed “zombies.” This enables an attacker to exert control over them. Botnet operators can command and control botnet devices by delivering commands to perform harmful acts using a covert channel, such as Internet Relay Chat (IRC). DDoS attacks, spam mail distribution, and information theft are all examples of such actions.
The attack methods previously stated can be carried out using the SlowHTTPTest software [22]. Slowloris, Slow HTTP POST, Slow Read, and Apache Range Header are among the application-layer DoS techniques that it effectively implements. Slow application-layer attacks target web servers that do not enforce connection timeouts. Concurrent connections are what bring the server down in the end. The SlowHTTPTest utility is seen in Fig. 2 enacting a Slow Read DoS attack.

Slow application-layer attack with SlowHTTPTest tool
Data collection and analysis
There are numerous tools available for capturing, parsing, and analyzing both FPC and Netflow data. T-shark [23] is a network protocol analyzer that comes included with Wireshark. T-Shark collects and analyzes network traffic (pcap files). Pcap is an application programming interface for network traffic capture. Tcpdump [24] is a popular packet analyzer that shows packets sent or received across a computer’s network connections. Additionally, Tcpdump allows for the saving of packet contents to a file for later examination. Cisco’s products use Netflow version 9 [25] for network traffic accounting, security, DoS monitoring, and general network monitoring.
Another open-source product used for Netflow collection is Nfdump [26]. The subset of software tools in Nfdump can collect and process Netflow data. It collects Netflow data via Nfcapd-stored records and analyzes as per the parameters specified. Nfdump supports Netflow versions v1, v5, v7, v9, and IPFIX. In our experiment, we used Dumpcap [27] and the SiLK tool suite for collecting FPC and Netflow data.
Related works
Zargar et al. [28] classify distinct types of DDoS flooding at the application layer. At the Open Systems Interconnection (OSI) network and transport layers, flooding attacks based on reflection amplification occur. The strategies used in these attacks are the same as those used during application-layer attacks. HTTP flooding attacks consume a greater portion of the attacker’s session connection request rates than legitimate user requests. HTTP GET/POST flooding is a well-known example of this type of attack, wherein the attackers send a large number of legitimate GET/POST requests to the targeted web server. Attackers submit sessions with more requests than normal, leading to a DDoS flood attack disabling the server.
Attackers utilizing image processing methods breach CAPTCHA codes [29]. The noise in the background is eliminated from the CAPTCHA image before it is separated for verification. These images consisting of background noise make them difficult to detect by machine-based recognition. But such material often renders photos hard to read by people. The consequence of these actions can cause legitimate users to grow irritated, and services given may be restricted.
Publicly available datasets have been used in research on application-layer DDoS like [30,31,32], but they are outdated logs. The authors of all three studies collected the first and second logs in 1995 for 7 days. Other captured public datasets were collected in 1998. As a result, it is devoid of traffic generated by new apps or abnormalities. [10] focus on backbone traffic anomaly detectors and provides labeled backbone traffic in the absence of packet payloads and flows that are incomplete or asymmetric. Their approach aims to mitigate undiscovered hostile traffic that masquerades as legitimate traffic and to design a customized anti-DDoS module for general and specific DDoS tool attacks by incorporating a taught classifier into a random tree machine learning method.
Chengxu et al. [33] developed and provided a publicly available dataset, representing one 24-h day of log-only traffic. One day is just a snapshot of what was happening that day. Multiple-day logs would have to be collected and averaged for better results to represent what took place accurately. Also, this dataset is just a log and does not represent a full packet capture, which would help in a more in-depth analysis.
Simulations at layer seven (of the OSI) and application-layer DoS attacks sometimes employ valid IP addresses and imitate lawful queries [34]. By injecting malicious payloads into their dataset, [35] formalize their assault and normal traffic on the server. The authors demonstrate the capacity of the statistical model checker PVeStA to thwart application-layer DDoS attacks using a defense mechanism and a computational system called Maude.
Vijayalakshmi et al. [34] conducted application-layer DoS attacks via packet header processing. These assaults typically employ genuine IP addresses, imitate normal requests, attack or destroy the server with a damaging payload, and use worms to form a botnet. Their work is being implemented in the National Technical Research Organization’s Smart and Secure Environment Test Bed. Classification is performed using non-flooding application-layer attacks on simulated models. To utilize the Mahalanobis distance, we compare two statistical distributions. This is a standard distance metric. They then compute the distance between the newly observed payload’s byte distribution and the profile computed from the model for the relevant length range. The greater the distance score, the more suspicious this payload is.
Yadav et al. [36] used HTTP requests which attack the nitt.edu web server with the same attack dataset used in their testbed. A switch is utilized, connecting approximately 100 PCs to the webserver as two bots use Java LOIC and Golden Eye Master for the attack. All incoming traffic towards the webserver is captured using traffic capture software. This provides them with three various attacks. Though they should be complimented for their work, we believe improvements can be made by collecting attacks and normal traffic in a live environment instead of a testbed. This would provide a better representation of overall traffic for the datasets. In addition, along with logs from the server, full packet captures would give more in-depth datasets to use for analysis on their own and as a comparison to log datasets.
Durcekova et al. [37] discussed the use of HTTP GET and POST to exploit the HTTP protocol’s weaknesses. The attacker sends a large number of malicious HTTP GET requests to the target server in this sort of attack. Due to the fact that these packets contain genuine HTTP payloads, vulnerable servers are unable to discriminate between legitimate HTTP GET requests and malicious queries. As a result, servers must handle all requests as normal requests, eventually exhausting their resources.
Stevanovic et al. [38] initiated three possibilities of assault. Initially, the attacker compiles a list of directly available websites from the website’s home page via a single URL. Following that, the attacker generates a surfing sequence by selecting randomly from this list of pages. The second attack estimates the popularity of a page by contacting the Google search engine. The third stage builds an attack sequence from the website’s index.html page and subsequent pages. They are ordered randomly via a connection between web pages.
Devi et al. [39] proposed a scheme to defend against DDoS attacks in the application layer and schedule the flash crowd during these attacks. Their main goal is to stop suspicious traffic and provide services to legitimate users. HTTP GET flood requests and perform massive file downloads from the victim server.
An architectural improvement, known as CALD that defends Web servers from multiple DDoS attacks masked as flash crowds, is described by Wen et al. [40]. The first assault, dubbed “repeated request DDoS”, organizes numerous infected computers by continually sending queries to the website’s homepage. MyDoom and Code Red are all examples of this type of DDoS attack. The second method creates a list of premium pages and picks one at random for every HTTP GET request. The third method targets HTTP GET queries. This DDoS attack with recurring loads requires less effort from the attacker as well as being harder to detect.
Chwalinski et al. [30] used HTTP GET attacks using sequences of requests to limit the accessibility of web servers. They assume that sequences of requests provide enough information for detection. Therefore, numerous methods have been developed that attempt to learn legitimate behavior from weblogs. The authors also define a clustering algorithm used for legitimate sequence grouping. Attacking host techniques are shown that closely resemble human agents. This clustering algorithm’s performance is hard to emulate. Statistical measurements to identify attacker hosts are then presented, along with their detection accuracy.
Xu et al. [41] utilized a unique user behavior-based detection approach to detect application-layer asymmetric DoS attacks. Asymmetric attacks deliver requests that require a lot of work, such as dynamic interactive pages, database queries, and sophisticated script requests. A more covert attack occurs when attackers manage numerous workstations spread across a large area, use legitimate high workload requests, and use the actual IP address. The rate of request attacks is not always greater than that of authorized users. Their requests are frequently disguised as normal ones. Asymmetric attacks are difficult to detect using present approaches.
Singh et al. [42] investigated the effect of application-layer DDoS attacks on web services utilizing the NS2 simulator’s web cache model. They launch an application-layer DDoS attack against the webserver with an NS2 simulation using the webcache/webtraf model. Twenty attackers start at a short random time. The 20 clients are regarded as bots capable of making HTTP request/response traffic at 800-s intervals. The duration of the whole attack is 700 s, i.e., the attack runs from 800 to 1500 s. NS2 simulations lack a real-world environment that would provide an accurate picture and reliable data from actual networks.
Vlajic and Slopek [43] used so-called Puppetnets to launch application-layer DDoS attacks. Their other attack spreads web bugs via email. Puppetnets are a collection of HTML/JavaScript commands that are inserted into the HTML/JavaScript code of a high-traffic, otherwise legitimate-looking website. DDoS attacks employ spam email with web bugs to hijack the browsers of legitimate people. A web bug inserted in an email enables the sender to track the precise time the email was opened for the first time and then revisited.
Stevanovic et al. [44] conducted three synthesized attacks categorized and employed in their work. “Trivial Attacks” use bots to send standalone HTTP requests with unidentified and banned User Agent Strings (UAS). The exploit distributes independent HTTP requests that contain faked UASs with a harmless crawler. Slow Read and Slow POST are known examples of such attack methods. A semi-random series of HTTP requests from each bot appears to have been produced by a valid Web browser.
Dantas et al. [35] used Maude’s computational tool [45] to launch two distinct DDoS attacks. Maude is a logic-based tool for specifying and analyzing real-time systems in a formal manner. The attacks studied were HTTP PRAGMA as well as an HTTP POST. The PRAGMA HTTP header field is meant for HTTP protocol requests. Updated models of formerly required resources are made accessible to the application and any intermediary libraries. The application receives PRAGMA messages that reset timeouts, allowing the connection to continue, and the receiver’s connection is kept open in the program’s memory. After a client completes the form’s input, the HTTP POST attack sends a request. Its purpose is to tell the webserver about the form’s data input. On getting a POST request, the webserver accepts the form’s content. The attacker sends a POST request to the website providing the data size. Rather than transmitting large chunks of the entry, as legitimate clients would, the attacker sends a little bit of data every message, using the application’s resources for a prolonged period of time.
None of the related works examine multiple application-layer DoS attacks using Netflow features and machine learning predictive models. In addition, we are the first to use feature selection and PCA for application-layer DoS detection.
Experimental procedure
This section summarizes our experiments involving four slow application-layer attacks, including the data collection approach, dataset aggregation, machine learning algorithms, metrics, data pre-processing, as well as feature selection.
Data collection process
The gathering of Netflow data requires the use of hardware and software to gather, categorize, and save information for processing and tracking. Figure 3 exhibits the network architecture that enables us to carry out attacks on a real-world network with a large number of active users. Downloads, uploads, website navigation, and other web server communications are all considered normal network traffic. They can access course materials from our server both locally and remotely. A firewall protects data and network resources against unauthorized access. On the Apache webserver, student resources have been put up as a target for our attacks. Dumpcap [27], a component of the Wireshark software suite, is used to capture packets on a Linux-based server. Dumpcap is software designed to capture packets from a network and save it to storage. Dumpcap continuously monitors packets and archives recorded packets for later analysis and is frequently the major source of data utilized to analyze network traffic.

Network architecture
Our Netflow data is collected and stored with the SiLk software suite. SiLK collects FPCs and builds network flows. SiLK can convert FPC files to SiLK network flow records and export them as Comma-Separated Values (CSV) datasets for machine learning [46]. Our controlled attacks NetFlow data is analyzed to identify attack classifiers utilizing IP addresses that performed the attack and the remainder as normal. Netflow data does not offer the amount of forensic detail discovered in FPC data. Still, the small size allows it to be retained for a much longer time, which is incredibly valuable when performing an analysis [6]. Netflow provides a lot of flexibility and functionalities that assist with detecting anomalies with flows that have proven effective in detecting DoS evasion strategies. Prior to identifying our data records, a data purification step was required.
Application-layer attack frameworks
We used three datasets (HTTP POST, Slowloris, Slow Read) from previous research and one attack (Apache Range Header) newly created from this study. These four separate attacks represent variations in attack duration ranging from 5 to 60 min time frames. Our study focuses on capturing multiple application-layer DoS attacks against our web server. Our acquired attack data is easily identifiable because the attacks come from the IP addresses we performed in the attack. An attackers’ IP address uniquely identifies (labels) attack traffic, whereas all other instances are considered normal. By integrating controlled attacks, the labeling ensures correct attack labeling. We complete the data cleansing procedure by processing the data using SiLK and exporting it as a CSV file, using Pandas [47] to validate it.
Slowloris attacks are performed on a physical host machine rather than simulated. We choose to use the Slowloris.py attack script for our tests. It was easy to set up and had several attack choices [48]. Our Slow Post attack tool was OWASP Switch-blade 4.0 from the Open Web Application Security Project (OWASP) [49]. We investigated popular alternative tools and settled on OWASP Switchblade due to its flexibility. Instead of a distributed attack, we employed a single physical host machine with numerous connections [48]. Slow Read attacks are performed on a physical host machine with the SlowHTTPTest tool [22]. Variations in settings used by SlowHTTPTest are applied to give us different results and valuable information on the attack thresholds [46, 50]. The SlowHTTPTest tool was also used for the Apache Range Header attack. For more in-depth information on the dataset collection process and environment, please refer to each of these cited works.
Aggregation of datasets
All four datasets, Slowloris, Slow Post, Slow Read, and Apache Range Header, were collected by our research team. The aggregated features of the four datasets produced the new dataset for our experiment. The aggregated slow attack dataset has 828,510 instances consisting of 34,097 attacks and 794,413 normal traffic. When comparing each previous dataset to the aggregated dataset, there was no significant impact on performance due to the imbalance in the data. We removed the “attribute” feature because it was an insignificant factor in previous datasets. The difference in the results both with and without the attribute feature was negligible. Eliminating it can also help with overfitting. Table 1 below names and describes the multiple slow attack feature set produced from the four datasets used for our experiments.
Potential attack instances correlate to the InitialFlags symbol “S.” The letter “S” stands for “SYN,” which denotes the start of a TCP connection. The letter “P” stands for “PSH,” which means “received packets” rather than “buffering.” Instead of buffering packets, the “URG” flag instructs the receiver to process them. The letter “A” stands for “ACK” and signifies that the message has been received successfully. After a connection is ended, the value “F” indicates that the sender has ceased transmitting more data. The value “R” stands for “RST,” and it is delivered to reconnect the two parties. The properties for the session and initial flags are made up of eight TCP flags given in Table 2.
Machine learning
Six classification techniques were chosen to develop predictive models using the datasets we collected. The classifiers used in our work belong to various machine learning families of algorithms and are widely considered to be reliable. We developed all of the models using the machine learning tools Weka [51] from the Waikato Environment for Knowledge Analysis. Weka is a data analysis framework that contains visualization tools and algorithms.
C4.5 is a decision tree learning method that can help with classification and decision tree construction. When training, the classifiers form a hierarchy and learn parameters from the data model. We used two versions of C4.5: one with WEKA’s default parameter values (dubbed C4.5D) and another with Laplace smoothing turned on, and tree-pruning turned off (dubbed C4.5N). Laplace adds a small number to each of the counts in the frequency table, ensuring a greater than zero probability for the features in each class. Deactivating tree pruning allows the tree to perfectly classify the training set, which supports Laplace smoothing.
By selecting randomly from a set of features, RF produces several decision trees. RF uses more decision trees than other standard classification algorithms and has lower prediction errors.
k-Nearest Neighbors (kNN) employs a distance function to discover most examples similar to the current instance. The distance function for our work is Euclidean. This study uses majority voting with k = 5. Thus there are no ties. After running trials with K equaling 1, 3, 5, and 7, k = 5 produced the best results.
NB is a classification algorithm that uses Bayesian inference. The algorithm is designed to be feature autonomous. In our experiment, we made one adjustment from the default settings. We chose to enable “useSupervisedDiscretization” in Weka. We use supervised discretization to convert numeric attributes to nominal ones. NB uses a “binning” approach for data smoothing. Binning sorts the data and then distributes the sorted values into several buckets known as bins. Binning methods refer to the neighborhood of values, replacing each value in a bin with the mean, median, or closest boundary. The last machine learner used in our experimental process is JRip. This rule-learning technique assigns a single class to data samples and looks for a set of rules that appropriately classify the data points. The class’s original ruleset produces fewer errors as the rules expand in scope.
Evaluation metrics
Cross-validation with four rounds uses the same proportion of observations groupings to produce average performance values and reduce random selection bias. The Area Under the Receiver Operating Characteristic (ROC) Curve (AUC) values denote the probability that a classifier will distinguish between a randomly chosen positive instance (correctly classified) and a randomly chosen negative instance (incorrectly classified). The data is divided into non-overlapping sections by cross-validation, which keeps the original class proportions in each fold. In each round, one element is retained as test data and the rest as training data. The AUC values for each of the five data points are calculated by averaging the AUC values of the assessed models. In other words, the number of models created to compute the average is 5 (folds) multiplied by 4 (iterations) will equal 20 models.
In machine learning, the statistical classification uses a confusion matrix table layout that allows visualization of the performance of an algorithm. The confusion matrix has the following four values. True Positives (TPs) is the number of positive instances correctly predicted as positive, True Negatives (TNs) is the number of negative instances correctly predicted as negative, False Positives (FPs) is the number of negative instances incorrectly predicted as positive, and False Negatives (FNs) the number of positive instances incorrectly predicted as negative.
The AUC and precision-recall of each model are calculated as follows. Precision (positive predictive value) in machine learning refers to the proportion of relevant occurrences among the recovered instances. Whereas, recall (sensitivity) refers to the proportion of pertinent instances that are retrieved. The True Positive Rate (TPR) and False Positive Rate (FPR) are plotted using the AUC. TPR is the percentage of slow attack incidents that are accurately anticipated as attacks. FPR is the proportion of normal data that was mislabeled as “attack.” As the decision threshold for the classifier is modified, the AUC curve is created. As the values of AUC increase, so does TPR while FPR decreases, producing acceptable results. Operating points in our metrics focus on minimizing Type II errors in absolute terms to the lowest value while maintaining above 90% F-measure scores and 95% or better AUC results.
There are two kinds of errors we use for metrics. Type I errors are false positives. False positives are a nuisance for machine-learning systems and account for roughly 40% of the alerts that cybersecurity teams receive daily [52]. Training a new device or software is standard practice on the network for a predetermined duration [53]. Type II errors are false negatives. They are both essential misclassification errors that should be minimized, but the emphasis should be more on the Type II error. Minimizing Type II errors is the most important focus of our experiment. It is more important not to miss an attack on a network than to identify an attack that is not. If a Type II error occurs, an attack has not been identified. The network is thus compromised, whereas mislabeling normal traffic as an attack is not as severe as a missed attack.
The F-measure is calculated from the confusion matrix in Weka using a weighted average. F-measure uses threshold measures for testing accuracy and weighted harmonic mean for precision-recall tests, conveying balances among precision-recall. An F-measure’s best value is 1 (perfect precision and recall), and the worst value is 0. High scores demonstrate that the classifier has accurate results, high precision, and positive results in a high recall. Results with high recall and low precision produce predictions that are inaccurate as they relate to training sets. High precision and low recall produce few results, and its predicted sets are accurate compared to training sets. A perfect scenario is demonstrated with high precision and high recall, returning many results, with all results labeled correctly. Equation 1 shows the F-measure equation.
Analysis of variance (ANOVA) is used to compare the variability in AUC and AUC Standard Deviation (Std) averages. The AUC Std value is calculated using the AUC values obtained for each learner. The F-distribution compares two independent groups’ means. We search for two equal means when testing the null hypothesis. A positive result indicates that the means of the AUC and AUC Std are not identical. The output from the ANOVA results in Table 5 is labeled as follows. The Df column indicates the individual variable’s degrees of freedom, which are determined as follows. The residuals take the total number of observations minus one, in the sum of squares between groups, as well as the entire mean described by such a variable, the Sum Sq. The Mean Sq equals the mean of the sum of squares. The F-measure value represents the mean square of each independent variable. A significant F-measure raises the risk that independent variable change is not an anomaly. The F-statistic p-value is represented as Pr(> F). Testing the null hypothesis without any difference between group means, we use the p-value.
The AUC averages were analyzed using ANOVA to see if there were any statistically significant differences in the detection of multiple application-layer DoS attacks among the six learners. Our data was also subjected to Tukey’s Honestly Significant Difference (HSD) post-hoc tests [54]. This test examines every possible pair of means to see whether they differ.
Feature selection
Selective feature evaluation uses several methods to specify the attribute evaluator and search methods. Attribute selection searches the space of attribute subsets, evaluating each one by combining one of the six attribute subset evaluators with one of the ten search methods. Feature subset evaluators process a subset of attributes and return numerical measures that guide the search. For our research, we employ the Weka functions CfsSubsetEval, ClassifierSubsetEval, and ConsistencySubsetEval. Additionally, we used the Weka functions ChiSquaredAttributeEval and Gain-RatioAttributeEval to evaluate single attributes. To create a ranked list, the ChiSquaredAttributeEvaluation and Gain-RatioAttributeEvaluation algorithms combine with the Ranker search strategy.
CfsSubsetEval evaluates a subset of attributes by examining the individual predictive ability of each feature and the redundancy between them. Feature subsets that have a high class correlation and low intercorrelation are preferred. ClassifierSubsetEval evaluates a subset of attributes on training data or a hold-out set. This method uses a classifier to estimate the worth of a set of attributes.
The ConsistencySubsetEval evaluator measures the consistency of class values after the training instances [55]. Subsets of highly correlated features with the class while having low intercorrelation (among the features in the subset) are preferred. Consistent subsets of features can not ever result in a lower total set of features. We use this subset analyzer to search for a minimal subgroup with a similar consistency to the complete collection of attributes. The association of subsets bases itself on merits between 0 and 1. The merit function will have larger values for attribute subsets that have attributes with strong class-attribute correlation and weak attribute-attribute correlation.
Single-Attribute assessors utilize their search method to build ranked lists with a search technique called “Ranker.” Ranker is a ranking technique for individual traits, not a search tool for subsets. It classifies features according to their ratings and conducts supervised learning by deleting the lower-level values.
The algorithm poses an initial hypothesis that a class and a feature are unrelated. Then, it works towards disproving the initial hypothesis. The Information Gain (IG) score for a particular feature is normalized by the attribute’s entropy, also known as the “Information Split Value” [56]. The algorithm determines the range of a feature in terms of a class’s entropy. Excellent qualities maximize a class’s entropy. The IG ranking results are normalized by the attribute and class entropy values in the Symmetric Uncertainty ranking technique. A good feature should have a high score.
As previously stated, PCA modifies and transforms the set of qualities. New attributes rank in order of their eigenvalues. The eigenvalue measures the amount of variance retained by each principal component. A subset chooses a sufficient number of eigenvectors that compensate for a specified percentage of its baseline variance of 95%. The dimensionality of our dataset is reduced by compressing it onto a new feature subspace. We accomplish this by selecting the subset of the eigenvectors, otherwise known as principal components, which contain most of the information that makes up the variance. The eigenvalues define the magnitude of the eigenvectors. We then sort the eigenvalues in decreasing order and focus on the top k eigenvectors based on their corresponding eigenvalues. PCA also helps us process our data for a T-distributed Stochastic Neighbor Embedding (SNE) that visualizes high-dimensional data by giving each data point a location on a two or three-dimensional map [57]. The simplified variant of SNE significantly enhances visuals by reducing the inclination for points to cluster on the map. Maaten et al. [58] suggest that t-SNE effectively creates a single map that reveals structure at many different scales.
Data processing
Our first step was to remove and impute missing values from the dataset. If a value is missing, we represent it with a single question mark. Therefore, no missing data values exist in our dataset. Our next step was to get the categorical data ready for our machine learning algorithms. We used the normalization approach to bring different numerical features onto the same scale. We rescale these numerical features using the min–max scaling equation shown in Eq. 2 that is created by rescaling the range of features to [0, 1] or [− 1, 1]. Our categorical features are flags, InitialFlags, and SessionFlags as shown in Fig. 4.
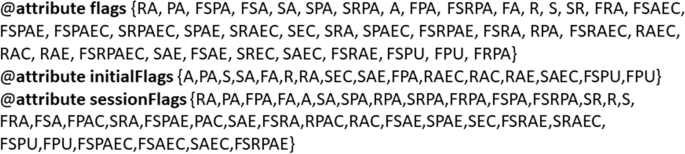
Flag values
Results
Our results for feature selection and machine learner performance are shown in the sections below. We present four different feature selection methods by comparing feature selection methods using six machine learning models. As previously mentioned, the Aggregated Slow Attack dataset has 828,510 instances consisting of 34,097 attacks and 794,413 normal traffic. Our goal is to achieve the same performance or better than the twelve-feature set using feature selection methods. Feature selection does this by focusing on the total number of Type I and Type II errors, with more focus on minimizing the total number of Type II errors. Maximizing the detection of the 34,097 attacks is critical because an incorrect prediction results in a successful attack. Therefore, we focus on operating points by expressing Type II errors in absolute terms to minimize Type II errors to the lowest value while maintaining above 90% F-measure scores and 95% or better AUC results.
Initial results
Overall, our Netflow dataset results show that Netflow features can distinguish between normal and attack traffic, with five out of six predictive models detecting multiple slow application-layer attacks. Consistent results demonstrate that when paired with Netflow data, classifiers are sufficiently selective to detect multiple slow application-layer attacks.
Normalization creates different features on the same scale via key features. Although values obtained are characteristic of enabled attack types, there is a possibility that our learners may place too much weight on the specific values obtained rather than the overall behavior of the feature in question. Tables 3 and 4 compare slow application-layer attack results before and after normalization. Figures 5 and 6 show the effects on the same branch of a decision trees rule with C4.5D.
Our classifiers’ AUC and F-measure findings demonstrate that all but JRip had good outcomes. All learners except JRip had similar AUC values of 0.981, 0.982, 0.981, 0.981, and 0.949 for both pre-normalized and normalized datasets, respectively. The significant and critical difference reflected in NB produces a better result for Type II errors with only 1246. Table 4 shows the other four top performers had over 13,000 Type II errors.
When examining both C4.5 trees, each tree structure determined which flags to display at the starting node of the tree. The flags are one of the most important elements of a successful slow application-layer DoS attack. C4.5’s decision trees divide data across two or more branches, depending on one or more attributes. The top-level branch structure is a reliable source for finding distinguishing characteristics for normal and attack data. Duration in milliseconds or Durmsec is an example of distinguishing characteristics at the top-level branch that produced Figs. 5 and 6.

Pre-normalized C4.5D tree branch

Normalized C4.5D tree branch
We see the rules generated by C4.5D in Figs. 7, 8, and 9, illustrating three decision tree examples. Durmsec is the only behavior that is consistent between the two. The Durmsec feature is used at the top tier of each of the three trees in the C4.5D model. We can tell the difference between regular and attack flows by their distinct behavior. Shown in Fig. 7, a rule detects an attack when Durmsec has a value greater than 0.040121, packets are greater than 0.001076, and the sessionFlags combination = PA and bytesPerPacket ¡ = 0.01029. Figure 8 has a shorter branch, with Durmsec again being greater than 0.040121 and packets greater than 0.001076, followed by a session flag combination of Finish, Reset, Push, Acknowledgment (FRPA). There are 3492 attack instances. Figure 9 starts again with Durmsec greater than 0.040121, bytesPerSec greater than 0.007724, sessionFlags producing PA, packetsPerSec not more than or equivalent to 0.006304, bytes equal to or more than 0.00079, and packetsPerSec less than or equal to 0.005616, identifying 2879 attacks. Figures 7 and 8 are similar, except for the different values for session flags on the third node. Figure 7 has a Push, Acknowledgment (PA) value with one more node (bytesPerPacket) and Fig. 8 has an FRPA value and ends there.

C4.5D model tree 1

C4.5D model tree 2

C4.5D model tree 3
ANOVA was used to determine whether or not there were statistically significant differences between the means of our six models. As indicated in Table 5, our F-value is 120.8825, and the p-value is less than 6.62e−15, indicating a significant difference between the groups. Based on the 95% confidence interval, our findings show that variation in mean values amongst classifiers has more weight than variation in mean values for all models.
As a result, the null hypothesis is rejected. Statistics show a link among learners and slow application-layer DoS attack detection, demonstrating differences are statistically significant. A Tukey’s HSD post-hoc test was used to identify the statistically significant differences between learners. To categorize our models, we used a Tukey’s test. Table 6 shows the top five learners in Group A and JRip in Group B. The classifiers and percentages associated with the various letter clusters are different. This identifies two levels (A and B) of performance groupings within the machine learners. Group A learners, RF, C45N, C45D, 5NN, and NB were significantly better than the other learner JRip from Group B.
Feature selection results
The following section shows the results of our experiment when applying the Weka feature selection functions CfsSubsetEval, ConsistencySubsetEval, Single-Attribute, and ClassifierSubsetEval methods.
The Correlated-based feature selection (CFS) assessors employed Rank Search Chi-Squared (RSCS), Greedy Stepwise-Forward (GSF), Greedy Stepwise-Backward (GSB), Rank Search Gain Ratio (RSGR), Best First-Forward (BFF), and First-Backward (BFB). Table 7 contains the results for CFS evaluators. Both generated a subset of flags with three features: bytesPerPacket, bytesPerPacket, and Durmsec. The three-feature set performs well, with AUC values of 0.650 for the five Group A classifiers and 0.650 for our Group B classifier, JRip. The F-measure had similar results for all the models, with JRip as the lowest with 0.963. The performance metrics of C4.5N and C4.5D had similar Type II errors with 14,777 and 14,788 for the three-feature set. NB and 5NN had slightly fewer Type II errors, with 14,390 and 14,750, respectively. RF had the least amount of Type II errors overall, with 13,060. By condensing the feature space to the most relevant features, the CFS feature selection technique achieves effective performance with fewer features, reduces the likelihood of overfitting, and speeds up processing. Five out of six classifiers are effective at detecting slow application-layer attacks using the three-feature subset.
Our second attribute subset evaluator, ConsistencySubsetEval, used two search methods [Random Search (RS) and Exhaustive Search (ES)] and two options (forward and backward search). We denote these methods as, BFF, BFB, ES, and RS. ConsistencySubsetEval had favorable AUC results with the six classifiers as shown in Table 8. The 10-feature subset includes Packets, Bytes, SessionFlags, Flags, Durmsec, PayloadInBytes, PayloadRate, PacketsPerSec, BytesPerSec, and BytesPerPacket. The F-measure and correctly classified instances had similar results for all the models, verifying the predictability. NB had a significantly lower number of Type II errors with 1168, followed by C4.5D, C4.5N, RF, and the highest number of errors for JRip at 23,354. As mentioned previously in this paper, Type II errors are critical for predicting attacks on a network. With this ten-feature dataset, NB distances itself from the rest of the classifiers for detecting attacks on a network. The Consistency Feature selection substantially reduces the number of features that can differentiate among normal and attack data in relation to the four slow application-layer attacks: Slowloris, Slow Post, Slow Read, and Apache Range Header.
The four single-attribute evaluators, Gain Ratio (GR), Chi-Squared, Symmetric-Uncertainty, and IG, created a ten-feature set. The ten-feature set includes Packets, Bytes, Flags, InitialFlags, SessionFlags, Durmsec, PayloadInBytes, PacketsPerSec BytesPerSec, and BytesPerPacket. The difference between this ten-feature set and the previous is two features. The previous set included PayloadRate but not InitialFlags as compared to this ten-feature set. In reference to the four single-attribute evaluators, Chi-Squared produced the most favorable results, which are shown in Table 9. The ten-feature set performs well, with AUC values for the Group A classifiers and slightly less for the Group B classifier, JRip. The F-measure and correctly classified instances had similar results for all the models. NB again had a significantly lower number of Type II errors than all other machine learners with 607, followed by C4.5D, C4.5N, RF, and the highest number of errors for JRip 23,360. As mentioned previously in this paper, Type II errors are critical for predicting attacks on a network. NB had its best performance for Type II errors with 607.
The Classifier Subset evaluator performed well with ten features as shown Table 10. They are Packets, Bytes, InitialFlags, Flags, Durmsec, PayloadInBytes, PayloadRate, PacketsPerSec, BytesPerSec, BytesPerPacket. This ten-feature set eliminated SessionFlags as compared to the previous two ten-features sets. The ten-feature set also shows good performance with AUC values for Group A classifiers, followed by Group B classifier JRip 0.656. The F-measure had similar results for all the models. Again, the performance metrics for C4.5N and C4.5D were similar. C4.5N had a slightly lower number of Type II errors than C4.5D, with 13,026 and 13,050 for the ten-feature set. RF and 5NN had slightly fewer Type II errors, with 13,025 and 13,060, respectively. NB consistently has the least amount of Type II errors overall, with 1085, while maintaining similar AUC and F-measure results.
PCA results
Table 11 displays the results of six classifiers using PCA. We sorted the eigenvalues by decreasing significance and selected the eigenvectors based on the largest eigenvalues representing 95% of the variance in our dataset. We then used the new feature subspace from PCA with our six learners.
The PCA dataset had the best results with NB. It had the lowest value for Type II errors with 554 and slightly improved its AUC and FPR at 0.981 and 0.089. NB performs substantially better than all other learners in minimizing false negatives, demonstrating that it can better protect a network. PCA produced some noteworthy results. JRip, which had been significantly high with Type II errors, was similar to RF, C4.5N, and C4.5D, and 5NN had an improved AUC of 0.774, though it was the lowest. C4.5N, C4.5D, RF, and 5NN had similar Type I and Type II errors. False alarms account for roughly 40% of the alerts that cybersecurity teams receive daily. This number of false alarms can be overwhelming, as well as an enormous waste of time [53]. Training a new device and software is standard practice on the network for a predetermined duration [52].
ANOVA was used to examine statistically meaningful disparities among the six classifiers’ AUC values for multiple slow application-layer attacks. The F-value for Table 12 ANOVA is 739.874 and the p-value is less than 1.0446e−10. As with the initial AUC results, our results suggest that the variance of means between different learners is significantly more relevant than the fluctuation in mean values for all models.
We reject the null hypothesis once more. Our PCA results show that the differences between learners and multiple slow application-layer DoS attack detection are statistically significant. As illustrated in Table 13, the majority of groupings produced close pairings, with our models, RF, C45N, C45D, 5NN, and NB being assigned to Group A and JRip to Group B.
Table 14 displays how our five feature selection methods and Group A classifier performed using feature selection methods against the original twelve features. The acronyms from the table are CFS, Consistency Subset Selection (CON), Single-Attribute Selection (SA), and Classifier Subset Selection (CLS). NB had the best performance regarding Type II errors in four out of five feature selection methods. NB performed very well with SA and PCA for Type II errors with 607 and 554, respectively. These results reflect a significant difference as compared to the other five learners. When comparing NB results against the original twelve features, it more than cut in half the number of Type II errors when applying the PCA method. NB with PCA had the best overall performance for detecting multiple application-layer DoS attacks.
Discussion
We collected all traffic on a live network using a Linux web server in order to analyze our aggregation of slow application-layer DoS attacks using Netflow data for the purpose of detecting slow DoS attempts. The capture generated Netflow data, which was examined by six machine learners to determine their ability to predict multiple slow application-layer DoS attempts. After that, we applied feature selection algorithms that proved effective performance with fewer features for discriminating between normal and attack data with our DoS attacks. As the findings demonstrate, feature selection datasets produced favorable performance ratings. When comparing Type II errors using feature selection approaches, there was a significant difference between NB and the rest of the Group “A” models.
In summary, Netflow can play a significant role in a network monitoring solution for multiple slow DoS attacks. One benefit of using Netflow is the speed at which an attack can be detected in real-time. This is critical and increases the chance of purging an attack before it does any damage. Netflow data is modest in size, which reduces processing time and makes it easier to read, analyze, and warn network managers when abnormalities and statistics are detected. If a learner achieves the same detection level with less data, this reduces the demand for CPU resources, increasing computational efficiency. Additionally, as a network scales in size, this becomes critical when using Netflow data. Combining Netflow with machine learners is efficient in detecting and alerting network security for multiple slow DoS attacks.
We realize that our methodology was not implemented and validated in real-time. This is one limitation that will be addressed in future work. Another limitation is the use of only one feature extraction method PCA. Future work will compare the use of PCA with other methods of feature extraction.
Conclusion
We suggested a method for detecting multiple application-layer slow DoS attacks by successfully utilizing machine learning and Netflow data. Four rounds of stratified five-fold cross-validation were used to calculate performance metrics. This research produces normal and attack traffic on a publicly accessible web server that is accessed by the campus community and the public at large. We give a more accurate depiction of the genuine network environment than previous testbeds by expanding our capture and including actual attacks alongside normal network traffic. Additionally, this strategy strengthens the integrity of our data by utilizing real-world traffic rather than related works that are not. We used the SlowHTTPTest software to conduct four unique attacks with varying modifications on each. The purpose of this experiment is to determine whether features aggregated from four separate slow DoS attacks are effective at detecting them.
Our investigation demonstrates that this technique for detecting multiple slow application-layer DoS attacks using features from Netflow data has a high AUC and a low percentage of false positives and negatives. For identifying multiple slow application-layer attacks, NB has the lowest Type II error rate. When we used feature selection approaches, we observed that the five Group A models had comparable acauc values and fewer Type II errors. NB used PCA to extract features from the original twelve features, resulting in the lowest Type II errors, and F-measure score of more than 90%, and an AUC value of 95% or greater.
Additionally, we demonstrated that all six learners performed admirably with Netflow data in detecting multiple application-layer slow DoS attack traffic, with five of them outperforming the remaining learner. As a result, machine learning models trained using Netflow features may successfully discern attack and normal network data across slow multiple application-layer DoS attacks.
Future work will conduct a cumulative and comparative evaluation of the detection and discrimination of multiple slow application-layer attacks using multi-classifiers and Netflow data. We will also further evaluate the impact that threshold adjustments can have on other performance metrics. In addition, the real-time implementation and validation of our approach will be investigated. Finally, future work will compare the use of PCA with other feature extraction methods to evaluate different intrusion detection models.
Availability of data and materials
Not applicable.
Abbreviations
- 5NN:
-
5-Nearest Neighbors
- ANOVA:
-
Analysis of variance
- API:
-
Application programming interface
- AUC:
-
Area Under the Receiver Operating Characteristic (ROC) Curve
- BFB:
-
Best first-backward
- BFF:
-
Best First-Forward
- CFS:
-
Correlated-based feature selection
- CLS:
-
Classifier Subset Selection
- CON:
-
Consistency Subset Selection
- CSV:
-
Comma-Separated Values
- DDoS:
-
Distributed Denial of Service
- DNS:
-
Domain Name Service
- DoS:
-
Denial of Service
- ES:
-
Exhaustive Search
- FN:
-
False negative
- FNR:
-
False negative rate
- FP:
-
False positive
- FPC:
-
Full packet capture
- FPR:
-
False Positive Rate
- FRPA:
-
Finish, Reset, Push, Acknowledgment
- GSB:
-
Greedy Stepwise-Backward
- GR:
-
Gain Ratio
- GSF:
-
Greedy Stepwise-Forward
- GUI:
-
Graphical User Interface
- HOIC:
-
High Orbit Ion Cannon
- HSD:
-
Honestly Significant Difference
- HTTP:
-
Hypertext Transfer Protocol
- IG:
-
Information Gain
- IPFIX:
-
Internet Protocol Flow Information Export
- IRC:
-
Internet Relay Chat
- kNN:
-
K-Nearest Neighbors
- LOIC:
-
Low Orbit Ion Cannon
- NB:
-
Naive Bayes
- OSI:
-
Open Systems Interconnection
- OWASP:
-
Open Web Application Security Project
- PA:
-
Push, Acknowledgment
- PCA:
-
Principal Component Analysis
- RF:
-
Random Forest
- RFC:
-
Request for Comments
- RS:
-
Random Search
- RSCS:
-
Rank Search Chi-Squared
- RSGR:
-
Rank Search Gain Ratio
- RUDY:
-
R U Dead Yet
- SA:
-
Single-Attribute Selection
- SiLK:
-
System for Internet-Level Knowledge
- SMTP:
-
Simple Mail Transfer Protocol
- SNE:
-
Stochastic Neighbor Embedding
- SSL:
-
Secure Sockets Layer
- Std:
-
Standard Deviation
- TCP:
-
Transmission Control Protocol
- TN:
-
True Negative
- TNR:
-
True negative rate
- TP:
-
True Positive
- TPR:
-
True Positive Rate
- UDP:
-
User Datagram Protocol
- URL:
-
Uniform Resource Locator
- UAS:
-
User Agent Strings
References
Zuech R, Hancock J, Khoshgoftaar TM. Detecting web attacks using random undersampling and ensemble learners. J Big Data. 2021;8(1):1–20.
Leevy JL, Khoshgoftaar TM. A survey and analysis of intrusion detection models based on CSE-CIC-IDS2018 big data. J Big Data. 2020;7(1):1–19.
Demoulin HM, Pedisich I, Vasilakis N, Liu V, Loo BT, Phan LTX. Detecting asymmetric application-layer denial-of-service attacks in-flight with finelame. In: Proceedings of the 2019 USENIX conference on Usenix annual technical conference; 2019. p. 693–707.
Mankier. nfcapd netflow capture daemon; 2009. https://www.mankier.com/1/nfcapd.
CERT: SiLK; 2022. https://tools.netsa.cert.org/silk/index.html.
Sanders C, Smith J. Applied network security monitoring: collection, detection, and analysis. Amsterdam: Elsevier; 2013.
Claise B, Trammell B, Zurich E, Aitken P. Specification of the IP flow information export (IPFIX) protocol for the exchange of flow information (RFC 7011). 2013. https://tools.ietf.org/search/rfc7011.
Benzel T, Braden B, Faber T, Mirkovic J, Schwab S, Sollins K, Wroclawski J. Current developments in deter cybersecurity testbed technology. In: Conference for homeland security, 2009. CATCH’09. Cybersecurity Applications & Technology. IEEE; 2009. p. 57–70.
Peterson L, Bavier A, Fiuczynski ME, Muir S. Experiences building planetlab. In: Proceedings of the 7th symposium on operating systems design and implementation. USENIX Association; 2006. p. 351–66.
Ndibwile JD, Govardhan A, Okada K, Kadobayashi Y. Web server protection against application layer DDoS attacks using machine learning and traffic authentication. In: 2015 IEEE 39th annual computer software and applications conference (COMPSAC), vol. 3. IEEE; 2015. p. 261–7.
Saravanan R, Shanmuganathan S, Palanichamy Y. Behavior-based detection of application layer distributed denial of service attacks during flash events. Turk J Electr Eng Comput Sci. 2016;24(2):510–23.
Hall M, Frank E, Holmes G, Pfahringer B, Reutemann P, Witten IH. The WEKA data mining software: an update. ACM SIGKDD Explor Newsl. 2009;11:10–8.
Radware. Radware’s DDoS handbook: the ultimate guide to everything you need to know about DDoS attacks. 2020. https://www.radware.com/social/ddoshandbook/.
Zeifman I. Global DDoS threat landscape Q3 2017. 2017. https://www.incapsula.com/ddos-report/ddos-report-q3-2017.html.
Braden R. Probing zero windows. 1989. https://tools.ietf.org/html/rfc1122#page-92.
Calvert C, Kemp C, Khoshgoftaar TM, Najafabadi M. Detecting slow http post dos attacks using netflow features. In: The thirty-second international FLAIRS conference. 2019.
CVE. CVE-2011-3192. 2011. https://www.cvedetails.com/cve/CVE-2011-3192/.
BlackmoreOps. DoS website using slowhttptest in Kali Linux slowloris, slow HTTP POST and slow read attack in one tool. 2015. https://www.blackmoreops.com/2015/06/07/attack-website-using-slowhttptest-in-kali-linux/.
SourceForge. Low orbit ion cannon. 2016. https://sourceforge.net/projects/loic/.
SourceForge. High orbit ion cannon. 2016. https://sourceforge.net/projects/high-orbit-ion-cannon/.
SourceForge. r-u-dead-yet. 2016. https://sourceforge.net/projects/high-orbit-ion-cannon/.
OffSec. Slowhttptest—penetration testing tools. 2021. https://tools.kali.org/stress-testing/slowhttptest.
Wireshark. tshark—Dump and analyze network traffic. 2021. https://www.wireshark.org/docs/man-pages/tshark.html.
Tcpdump. tcpdump—dump traffic on a network. 2022. https://www.tcpdump.org/manpages/tcpdump.1.html.
Cisco. NetFlow version 9 flow-record format. 2011. https://www.cisco.com/en/US/technologies/tk648/tk362/technologies_white_paper09186a00800a3db9.html.
Mankier. nfdump netflow display and analyze program. 2009. https://www.mankier.com/1/nfdump.
Wireshark. dumpcap Dump network traffic. 2021. https://www.wireshark.org/docs/man-pages/dumpcap.html.
Zargar ST, Joshi J, Tipper D. A survey of defense mechanisms against distributed denial of service (DDoS) flooding attacks. IEEE Commun Surv Tutor. 2013;15(4):2046–69.
Singh VP, Pal P. Survey of different types of captcha. Int J Comput Sci Inf Technol. 2014;5(2):2242–5.
Chwalinski P, Belavkin R, Cheng X. Detection of application layer ddos attack with clustering and likelihood analysis. In: 2013 IEEE Globecom Workshops (GC Wkshps), 2013. p. 217–222. IEEE
Chwalinski P, Belavkin R, Cheng X. Detection of application layer DDoS attacks with clustering and Bayes factors. In: 2013 IEEE international conference on systems, man, and cybernetics. IEEE; 2013. p. 156–61.
Liao Q, Li H, Kang S, Liu C. Feature extraction and construction of application layer DDoS attack based on user behavior. In: Proceedings of the 33rd Chinese control conference. IEEE; 2014. p. 5492–7.
Ye C, Zheng K, She C. Application layer DDoS detection using clustering analysis. In: Proceedings of 2012 2nd international conference on computer science and network technology. IEEE; 2012. p. 1038–41.
Vijayalakshmi M, Shalinie SM, Pragash AA. IP traceback system for network and application layer attacks. In: 2012 international conference on recent trends in information technology. IEEE; 2012. p. 439–44.
Dantas YG, Nigam V, Fonseca IE. A selective defense for application layer DDoS attacks. In: 2014 IEEE joint intelligence and security informatics conference. IEEE; 2014. p. 75–82.
Yadav S, Selvakumar S. Detection of application layer DDoS attack by modeling user behavior using logistic regression. In: 2015 4th international conference on reliability, Infocom technologies and optimization (ICRITO) (trends and future directions). IEEE; 2015. p. 1–6.
Durcekova V, Schwartz L, Shahmehri N. Sophisticated denial of service attacks aimed at application layer. In: 2012 ELEKTRO. IEEE; 2012. p. 55–60.
Stevanovic D, Vlajic N. Application-layer DDoS in dynamic web-domains: building defenses against next-generation attack behavior. In: 2014 IEEE conference on communications and network security. IEEE; 2014. p. 490–1.
Devi SR, Yogesh P. An effective approach to counter application layer DDoS attacks. In: 2012 third international conference on computing, communication and networking technologies (ICCCNT’12). IEEE; 2012. p. 1–4.
Wen S, Jia W, Zhou W, Zhou W, Xu C. CALD: surviving various application-layer DDoS attacks that mimic flash crowd. In: 2010 fourth international conference on network and system security. IEEE; 2010. p. 247–54.
Xu C, Zhao G, Xie G, Yu S. Detection on application layer DDoS using random walk model. In: 2014 IEEE international conference on communications (ICC). IEEE; 2014. p. 707–12.
Singh B, Kumar K, Bhandari A. Simulation study of application layer DDoS attack. In: 2015 international conference on green computing and internet of things (ICGCIoT). IEEE; 2015. p. 893–8.
Vlajic N, Slopek A. Performance and economies of bot-less application-layer DDoS attacks. In: The 9th international conference for internet technology and secured transactions (ICITST-2014). IEEE; 2014. p. 318–23.
Stevanovic D, Vlajic N. Next generation application-layer DDoS defences: applying the concepts of outlier detection in data streams with concept drift. In: 2014 13th international conference on machine learning and applications. IEEE; 2014. p. 456–62.
Clavel M, Durán F, Eker S, Lincoln P, Martí-Oliet N, Meseguer J, Talcott C. All about Maude—a high-performance logical framework: how to specify, program, and verify systems in rewriting logic, vol. 4350. Berlin: Springer; 2007.
Kemp C, Calvert C, Khoshgoftaar TM. Detection methods of slow read dos using full packet capture data. In: 2020 IEEE 21st international conference on information reuse and integration for data science (IRI). IEEE; 2020. p. 9–16.
Raschka S, Mirjalili V. Python machine learning. 2nd ed. Birmingham: Packt Publishing; 2017.
Calvert C, Khoshgoftaar TM, Kemp C, Najafabadi MM. Detection of slowloris attacks using netflow traffic. In: 24th ISSAT international conference on reliability and quality in design, 2018. p. 191–6.
OWASP. OWASP foundation. 2021. https://owasp.org/.
Kemp C, Calvert C, Khoshgoftaar T. Utilizing netflow data to detect slow read attacks. In: 2018 IEEE international conference on information reuse and integration (IRI). IEEE; 2018. p. 108–16.
Witten IH, Frank E, Hall MA, Pal CJ. Data mining: practical machine learning tools and techniques. Cambridge: Morgan Kaufmann; 2016.
Lemos R. 3 steps to keep down security’s false-positive workload. 2013. https://www.darkreading.com/analytics/security-monitoring/3-steps-to-keep-down-securitys-false-positive-workload/d/d-id/1140513.
Infocyte. Cybersecurity 101: what you need to know about false positives and false negatives. 2021. https://www.infocyte.com/blog/2019/02/16/cybersecurity-101-what-you-need-to-know-about-/false-positives-and-false-negatives/.
Laerd. One-way ANOVA. 2021. https://statistics.laerd.com/statistical-guides/one-way-anova-statistical-guide-4.php.
Liu H, Setiono R. A probabilistic approach to feature selection—a filter solution. In: 13th international conference on machine learning; 1996. p. 319–27.
Surendiran B, Sreekanth P, Keerthi ESH, Praneetha M, Swetha D, Arulmurugaselvi N. Feature subset selection for cancer detection using various rank-based algorithms. Int J Med Eng Inform. 2021;13(4):346–57.
Roweis ST, Saul LK, Hinton GE. Global coordination of local linear models. In: Advances in neural information processing systems; 2002. p. 889–96.
Maaten Lvd, Hinton G. Visualizing data using t-SNE. J Mach Learn Res. 2008;9(Nov):2579–605.
Acknowledgements
We would like to thank the reviewers in the Data Mining and Machine Learning Laboratory at Florida Atlantic University.
Funding
Not applicable.
Author information
Authors and Affiliations
Contributions
TMK introduced this topic to CK, who prepared the manuscript and the primary literary review for this work. All authors provided feedback to CK and helped to shape and finalize the research. All authors read and approved the final manuscript.
Corresponding author
Ethics declarations
Ethics approval and consent to participate
Not applicable.
Consent for publication
Not applicable.
Competing interests
The authors declare that they have no competing interests.
Additional information
Publisher’s Note
Springer Nature remains neutral with regard to jurisdictional claims in published maps and institutional affiliations.
Rights and permissions
Open Access This article is licensed under a Creative Commons Attribution 4.0 International License, which permits use, sharing, adaptation, distribution and reproduction in any medium or format, as long as you give appropriate credit to the original author(s) and the source, provide a link to the Creative Commons licence, and indicate if changes were made. The images or other third party material in this article are included in the article's Creative Commons licence, unless indicated otherwise in a credit line to the material. If material is not included in the article's Creative Commons licence and your intended use is not permitted by statutory regulation or exceeds the permitted use, you will need to obtain permission directly from the copyright holder. To view a copy of this licence, visit http://creativecommons.org/licenses/by/4.0/.
About this article

Cite this article
Kemp, C., Calvert, C., Khoshgoftaar, T.M. et al. An approach to application-layer DoS detection. J Big Data 10, 22 (2023). https://doi.org/10.1186/s40537-023-00699-3
Received:
Accepted:
Published:
DOI: https://doi.org/10.1186/s40537-023-00699-3