- Survey paper
- Open access
- Published:
The affordance of virtual reality to enable the sensory representation of multi-dimensional data for immersive analytics: from experience to insight
Journal of Big Data volume 5, Article number: 53 (2018)
Abstract
Using the theory of affordance from perceptual psychology and through discussion of literature within visual data mining and immersive analytics, a position for the multi-sensory representation of big data using virtual reality (VR) is developed. While it would seem counter intuitive, information-dense virtual environments are theoretically easier to process than simplified graphic encoding—if there is alignment with human ecological perception of natural environments. Potentially, VR affords insight into patterns and anomalies through dynamic experience of data representations within interactive, kinaesthetic audio-visual virtual environments. To this end we articulate principles that can inform the development of VR applications for immersive analytics: a mimetic approach to data mapping that aligns spatial, aural and kinaesthetic attributes with abstractions of natural environments; layered with constructed features that complement natural structures; the use of cross-modal sensory mapping; a focus on intermediate levels of contrast; and the adaptation of naturally occurring distribution patterns for the granularity and distribution of data. While it appears problematic to directly translate visual data mining techniques to VR, the ecological approach to human perception discussed in this article provides a new framework for big data visualization researchers to consider.
Introduction
Typically, visual analytics has been deployed when data problems are ill defined and/or the configuration of the data is not easily subject to algorithmic analysis. Within the context of big data these characteristics are the norm, leading to increased interest in applications known as visual data mining (VDM). The aim of VDM is to augment algorithmic analysis with human visual cognition, where data variables are mapped to graphic attributes and differentiated through spatial position, shape and colour, thus bringing human visual perception and creativity to analysis [1, 2]. VDM utilizes graphic mapping techniques ranging from graphs and scatterplots to tree maps, display icons, tag clouds and cluster grams. While there has being some activity and speculation on the potential of virtual reality (VR) for visual analytics, application has been hindered by limited access to suitable hardware [3,4,5]. The recent availability of low cost, high performing head mounted displays (HMD) and compatibility with feature rich application authoring platforms such as Unity, has facilitated increased interest in the potential of VR for visual analytics. This has led to the new sub-field of research termed immersive analytics, which explores the potential of immersion in VR to extend existing graphic mapping techniques [6].
The position we develop in this article contributes to the research agenda of immersive analytics through considering the affordance of the technology, with the objective of developing key principles that can inform the specification of software prototypes for immersive analytics. The term affordance will be familiar to many readers through Hartson [7], who clarified the practical utility of the theory for the design of Human Computer Interfaces (HCI). The concept of affordance was originally developed in psychology by James J. Gibson, whose ‘Ecological Approach to Visual Perception’ [8] was described at the time as a revolutionary shift away from cognitive theories of psychology [9]. As we will discuss, there are a range of ways in which affordance has been defined and used in different domains, but for the purposes of this introduction the broad definition below by Stuckey et al. developed in relation to the design of virtual environments, captures our intent. “… we use the concept of affordance to refer to the latent possibilities for action presented by an artefact, tool or environment” [10].
From this definition it would follow that VR tools and environments present different possibilities as compared to computer monitor displays, where data visualizations are based on gestalt perceptual principles. Gestalt approaches have proven effective for monitor based visualizations, but the theory of affordance suggests a re-valuation is appropriate when shifting to virtual reality environments. Embracing the experiences brought by VR technology, we aim to explore the latent possibilities for action that VR may provide for the task of discerning patterns and connections within big data representations. We deliberately use the open term ‘representation’ rather than visualization, as this enables the inclusion of aural, haptic and kinaesthetic approaches to data mapping enabled by VR. Data represented in a stereographic environment not only provides better visual acuity for the adaption of existing techniques such as scatter plots, it also enables the translation of big data complexity into multidimensional perceptual and interactive spaces that can be directly experienced and explored. Immersion within VR, potentially enables a sense of presence within the ebbs and flows of data, with the capacity for an extended sensory experience that provides alternate ways to discern patterns and anomalies, as compared to interaction on a monitor. Using the theory of affordance from perceptual psychology and as developed within human–computer interaction, we consider: what is the affordance of VR technology for the immersive analytics of big data?
To address this question, this article is organized in two sections. The first undertakes a targeted literature review of VDM and experiments with VR that have augmented visual mapping with movement and sound. We then introduce the emerging field of immersive analytics, a network of researchers who are exploring the potential of VR for data representations. Through critical discussion of three position papers within immersive analytics, we clarify the shift from allocentric visual analytics to egocentric spatial coding, which in neuroscience research has been found to align with respectively visual and spatial intelligence [11]. The objective of this first section is to engage with relevant previous work and current thinking, in order to locate the scope of this article within the wider field of data analytics and mixed reality.
In a second section we introduce the concept of affordance, as originally proposed in psychology and subsequently applied within the field of human computer interaction. The aim is to identify and discuss contemporary developments of affordance theory, as relevant to VR. From the perspective of affordance, we explore how the latency of VR lies not only in terms of direct perceptual properties—such as spatial perception, shape recognition, colour differentiation, movement detection, haptics and aural positioning—but also in relation to the emergent relational properties such as perceived complexity, regularity, perceptual grouping and segmentation.
In a concluding discussion we collate the points explored throughout the paper by way of an illustrated table that summarizes the affordance of VR in comparison to visual data mining undertaken on a computer monitor. Then, from the position of affordance theory, we propose key principles for developing applications for immersive analytics. The central idea that underpins these principles, is that by specifying information-dense virtual environments in relation to the capacity of human ecological perception, there is an opportunity to develop new approaches to exploring patterns, anomalies and connections within big data.
Background and scope of research
Visual data exploration and VR 1.0
Data Mining has been described by Oliveira et al. “as the extraction of patterns or models from observed data” [2] undertaken as part of the more general process known as Knowledge Discovery in Databases. They document how up until 2003, Data Mining was concerned with either model visualization or Exploratory Data Analysis (EDA). The distinction is primarily related to intent: for model visualization the aim is to communicate the outcome of data mining; while with EDA the aim is to leverage human visual perception to gain insight into pattern and outlier detection [12]. The proliferation of terminology continues with a reference to ‘discovery visualization’, which is differentiated in terms of being aimed at allowing users with domain expertise relevant to the data, to be involved in the visual data mining For the purposes of this review of relevant background, we use Visual Data Mining (VDM) as an overall term to describe activity where visualization plays a major role in the process of gaining insight into patterns, anomalies and connections within data. The insight may be undertaken solely through human interaction with data visualizations, or be undertaken in a hybrid approach where data mining algorithms are combined with interactive visualization.
By the mid 1990′s commercially available HMD’s and stereo projection systems were being explored for their potential for scientific data visualization, with research on human factors [13] and a range of applications being reported [14]. The first Computer Aided Virtual Environment (CAVE) was reported in 1992 [15], and was replicated in major research institutions world-wide. The focus of the early use of CAVE was on scientific visualization, with relatively minimal research into data visualization. However there are some examples that include: visualization of dynamic statistical graphs within a CAVE [16]; experiments with cubic arrays of data [17]; a hybrid VR and screen system [18]; and the use of a CAVE for visual data mining using 3D self-organizing maps [19].
Of particular relevance for our project is the research of Nagel et al. [20, 21], which in our view is one of the earliest and most comprehensive evaluations of virtual reality for visual data mining. They describe the software architecture of a system they name ‘3DVDM’, where subsets of a data base are statistically processed, transformed into symbolic graphical representations and visualized within a CAVE. For our project the technical details of their system are less relevant than discussion of their approach to representing data in VR. They reference research from psychology on pre-attentive perception or ‘pop up’ visual cues, such as spatial depth and proximity that are more easily discerned within a CAVE. The scope of their research includes ‘perceptual parameters’ not typically utilized in data visualization: pose, which refers to the spatial orientation of an object, noting that vertical or horizontal orientation provide efficient differentiation; texture, defined according to granularity, orientation and pattern; and dynamic object properties such as motion and lighting. Nagel et al. appear to have worked for several years on their 3DVDM system and their last published article updates progress, with an emphasis on adding sound and movement, exploring data from the ‘inside out’ and the provision of navigation tools to enable open-ended discovery. They critique typical VDM methods in relation to the potential of VR, arguing it is “necessary to re-think the basic principles” as compared to screen based 2D and 3D visualization [22]. This includes the aural dimension, with their VR environment including spatialized sound sources mapped to data variables, using either sampled sounds matched to categorical data, or synthesized sounds mapped to musical pitch.
While Nagel et al. have advanced the project in terms of temporal and aural dimensions, the use of 3D scatterplots provides the base for the overall data representation. Scatterplots map three data variables to X, Y and Z coordinates to produce 3D terrain-like visualizations that are described as ‘macro DV’. These data terrains are contrasted with ‘micro DV’, the mapping of other variables to geometric shapes aligned with the scatterplot. These shapes also have movement and dynamic colour properties that add additional layers of data variables. In discussion of their trials Nagel et al. report up to 10 quantifiable data variables, with three assigned to the macro DV (x, y, z coordinates) and the seven other variables that are mix of different shapes, color, orientation and sound. In conclusion, they report that VDM in VR does “help in discovering remarkable nonlinear data relations and substructures” [22].
Next generations of VR and immersive analytics
With the advent of new generations of HMD hardware (Oculus Rift, HTC Vive, etc.) there has been a renewal of interest in the potential of VR to enhance VDM. Our review of this ‘VR 2.0’ activity includes: a range of experiments using abstract visualization of data within collaborative worlds [23]; a position paper on embodied interaction and perception [24]; a case study on visualizing social media data [25]; a comprehensive overview and discussion of the challenges for data visualization [26]; a position paper and application for aerospace [27]; and the establishment of a network of researchers articulating immersive analytics as a specialist new field of research [28]. The premise behind the renewed interest in the higher spatial, graphic and aural fidelity afforded by VR is that the “more dimensions we can visualize effectively, the higher are our chances of recognizing potentially interesting patterns, correlations, or outliers” [23].
In terms of recent publications directly relevant to our project, the position paper by Olshannikova et al. [26] proposes a set of research challenges for virtual and augmented reality, to articulate an agenda for further research. This includes a brief overview of Gestalt principles of perceptual organisation as typically used for data visualization. They observe that due to inherent capacity limitations of human vision and cognition, the scale and complexity of big data pose a significant challenge. Given this challenge they propose the visualization should reduce complexity, by aggregating data in order to communicate overall trends and anomalies. They also propose data visualization should be informed by insights from the classic Gestalt theory, where visual elements are organized into groups according to the following principles: proximity (elements close together); similarity; symmetry (predilection for finding symmetric shapes); closure (tendency to close up incomplete geometric figures); figure ground (primary grouping of prominent and recessed elements). In effect, the agenda for VR and AR, as proposed by Olshannikova et al. continues visualization techniques from VDM where gestalt principles are used primarily through mapping of data according to spatial location, shape, color, size and representations of connections such as lines and boundaries. However given that these Gestalt principles have been developed and applied primarily in relation to two dimensional graphics, we suggest the shift to the AR and VR opens up new possibilities beyond transferal of existing visualization techniques.
Our proposition that there is much more potential for VR beyond VDM also responds to the critique of VR Big Data applications by Teras and Raghunathan [24]. Their paper summarizes history and current activity with VR, observing that that experimentation with Big Data and VR does not establish the rationale for the modes of interaction. They are especially critical of how research on interaction with data in VR has minimal theoretical grounding. As a way forward they introduce a phenomenological perspective centred on the concept of embodiment, as developed for information systems and HCI. Key references for embodiment include Dourish [29] who foregrounds the importance of context and dynamic interaction with information systems. He introduces ‘embodied interaction’ where the central principle is to allow practice to evolve in the course of users interacting with systems.
Other previous work directly relevant to this paper is an interdisciplinary network of researchers that have coordinated research into VR and AR through the term ‘immersive analytics’, defined by Chandler et al. as “… the development and evaluation of innovative interfaces and devices, as well as the corresponding interaction metaphors and visualizations that allow these to be used for understanding data and decision making” [6]. They identify a range of research questions that encompass collaboration paradigms, the spatialization of 2D data, re-evaluation of Shneiderman’s ‘overview, zoom, filter’ interaction principle [30], the affordances of technology and interface in terms of immersion, precedent from existing 3D visualization, the most fertile application areas, and the need for a common immersive analytics development platform. Subsequent to the positioning of immersive analytics by Chandler et al. a more conservative approach by Sadana et al. has been proposed that argues the potential of immersive technology should first be considered in relation to existing VDM techniques, before prematurely exploring novel approaches afforded by immersion [31]. Their argument is that principles of HCI design should be adhered to, of which they highlight four: combine pre-existing systems within the novel; the value of VR versus the cogitative and physical overhead; practicality of deployment to end users; and to publish performance limitations alongside video ‘trailers’ of interface design.
The scope of the challenge
We have outlined the historical development of VDM through to the recent establishment of immersive analytics. The purpose of the targeted literature review has been to locate the scope of our project and to identify relevant previous work. Our intent was not to provide a comprehensive overview, as this has been undertaken by Olshannikova et al. [26]. The field is emerging and is cluttered by a proliferation of terminology that has developed in response to the challenge of big data and advances in visualization techniques. As a way to graphically communicate the scope of our research we use established taxonomy diagrams: the reality continuum by Milgram et al. [32]; and the knowledge generation model for visual analytics by Scaha et al. [33]. We then discuss the key precedent of Nagel et as introduced above, and develop a table which combines the challenges and research questions identified in the position papers by Olshannikova et al., Chandler et al., and Sadana et al.
The reality continuum was conceived with an emphasis on vision, whereas contemporary virtual reality environments make use of aural and kinaesthetic senses and incorporate tactile senses to some degree. While it has been postulated that all human senses can be engaged virtually [34, 35], we restrict the scope at this stage of the research to visual, aural and kinaesthetic senses, as the technology to represent these is relatively mature. As illustrated in Fig. 1, the reality continuum also provides a succinct way to identify three areas of research activity: hybrid approaches that use digital visualization in combination with physical representations; situated analytics where the use of augmented reality is used to superimpose data within a real world context; and immersive analytics where the use of CAVE or HMD place the user within the data representation.

Reality continuum [32], extended to include senses (blue shading indicates research scope)
The scope of immersive analytics illustrated in Fig. 1 is part of the broader field of data analytics, which combines computer processing and human reasoning processes that include exploration, verification and knowledge generation loops. We locate our research within the summary diagram of Sacha et al. [33] in terms of the evaluation loop, where data models are visualized for the purpose of iterative interaction that can lead to insight and hypothesis (Fig. 2).

Knowledge generation model [33], redrawn (blue shading indicates research scope)
As identified in our literature review, the research of Nagel et al. provides useful precedence for the scope of our project. While it would appear that this research group is no longer active, their research based on the use of CAVE technology can now be revisited using low cost HMD hardware. Our research shares their premise that the multi-modal spatialization enabled by VR, affords a reconsideration of the basic principles of VDM, in particular Gestalt approachs to ordering visualization. This is not to undervalue the legacy of scientific and information visualization, nor the translation of these principles to 3D visual analytics undertaken on 2D screens. It is a fact none-the-less, that the key principles of visual data mining are based on modes of visualization that are grounded in two-dimensional imaging. We also note that one of the less recognized aspects of the big data phenomenon is that approximately 80% is spatial (geo tagged). Hence the potential to develop spatialized multi-dimensional ‘worlds,’ which allow the superimposition of multiple data types. The principles of human perception as cited within VDM discourse, are grounded in classic gestalt principles that are well established in relation to two dimensional images and graphics, but have proved problematic in translation to 3D dimension as visualized in two dimensions. We propose that to realize the potential of immersive analysis of data requires an extension or translation from this legacy. The potential shift is from visualization of data in three dimensions as observed on a screen, to the experience of n-dimensional spatialized and dynamic geometry, texture, colour and sound.
The ontology of immersive analytics
The three recent position papers by Olshannikova et al. [26], Chandler et al. [6], and Sadana et al. [31] identified in our literature review, provide an overview of key challenges and research questions as summarized in Table 1.
We observe that each of the position papers has a different emphasis on where research is needed. Paper 1 primarily deals with identifying hardware and software development, paper 2 has more concern with how the technology enables alternative paradigms of analysis, while the emphasis of paper 3 is on the pragmatics of integration and methodological rigor in evaluation. In terms of locating our contribution to these agendas we note 1(d) raises the issue of integrating human perception and cognition, which also aligns with the reference in 2(d) to the affordance of immersion to enable a shift from an allocentric to a more egocentric mode of analysis. To our minds, the issue of perception and the shift from object-to-object relationships manipulated from a stationary point of view, to that in which the point of view is in motion while evaluating the data, gets to a fundamental shift enabled by immersion. The ontology of immersive discovery is significantly different to preceding visual analytics which primarily employs an allocentric mode. The shift to egocentric spatialization also supports the propositions in 2(c) and 2(e) that alternatives to existing exploration models may be required to exploit the potential of immersive analytics. However, as reminded by the authors of paper 3, ‘different’ does not necessarily mean better for the pragmatic requirements of visual analytics users, who have become expert at reading the nuances of sophisticated information graphics. None-the-less the advent of big data, suggests that research into alternate models that exploits human spatial intelligence is timely. We note that apart from some discussion of tactile interfaces and a reference to the importance of sound for the visually impaired, the agenda for all three papers summarized in Table 1 assume vision is the primary sense involved in immersive analytics. As the precedent of Nagel et al. demonstrates, the kinaesthetic and aural senses can be productively employed to supplement vision in an immersive environment. In summary, to advance the field of immersive analytics, we propose the multi-sensory affordance of the technology in relation to human perception is a key issue that needs to be considered.
Perception and affordances
The origins of affordance theory and adaptation for HCI design
According to Gibson [8, 9] affordance refers to the perceived possibility of actions that a person may take in an environment. In contrast to the traditional cognitive approach, affordance theory suggests that excessive focus on the declarative semantic knowledge about the world and information processing is unnecessary, because humans perceive the environment in regards to its potentials for actions directly. This concept has evolved from the field of psychology to other disciplines, interaction design in particular. The concept of affordance creates a direct link between perception and action, and was later utilised by Norman [36] from a design perspective to propose the design of an object should suggest how the object can be used. In other words, affordances should provide users with strong clues to the function of things and provide unambiguous visual cues for their application and use. We consider that Gibson’s ecological framework is relevant to the design of virtual environments for immersive analytics, as it provides a promising and functional approach for defining the reality of experience, which may provide alternate approaches to using human perception in the knowledge discovery process [37].
Gaver [38] summarises the Gibson and Norman definitions of affordance through a focus on technology. He categorises the broad affordance concept into sub-types of affordance based on whether or not the notions of perceptual information and the physically realised affordances overlap. There is nevertheless one important common basis for Gibson, Norman, and Gaver. All three perspectives claim that affordances are directly perceivable without categorisation. For example, one does not first have to classify something as a member of the category “chair” to be able to sit on it, or cross a street avoiding being hit by a moving vehicle without having to classify a make of the car. The notion of affordance challenges the traditional cognitive approach which focuses on having to rely on stored semantic memories and associations in order to be able to interpret perceptual properties as overly complicated, and suggests that direct apprehension of higher-order qualities of sensory stimulation is a more plausible alternative.
“Cognitive, Physical, sensory and Functional Affordances” is the title of an influential position paper by Hartson [38], which expands the affordance theories of Gibson, Norman, and Gaver for the design of human–computer interfaces (HCI). Given the issue of interface is crucial to immersive environments, and that Hartson’s agenda is to clarify the practical utility of the theory, his use of affordance theory would appear useful. Hartson’s adaption for HCI develops four types of affordance—cognitive, physical, functional, and sensory. The first three are reasonably self-evident in terms of the practical requirements of HCI design: clearly the hardware and software interfaces should be physically ergonomic; be as easy to comprehend as possible; and provide functions relevant to the end user. However, the identification of sensory affordance as a distinct type requires some discussion. Hartson clarifies that the use of ‘perception’ is problematic in that it typically requires significant cognition. Hence where previous theories of affordance used perception to describe intuitive engagement with artefacts, Hartson uses the term ‘sensing’. The intent of identifying sensory as a distinct aspect of his affordance model is to remove ambiguity, to locate sensing as a significant contributor to human interaction, where vision, hearing and touch supports cognition and physical affordance to enable appropriate functional responses. We note however that in Hartson’s framework, while sensing has acquired an individual status it is still in a supporting role in relation to cognitive and physical affordance. From a HCI design perspective the articulation of the four affordance types are strategic, to enable clarity for the designer and to enable a comprehensive evaluation of interface development. We suggest the enhanced multi-sensory sensory experience available through immersion in VR, enables a potential shift in Hartson’s hierarchy, to elevate the role of sensing beyond a supporting role. When considering the further development of affordance theory, research into how the sensory affordance of VR can be exploited to advantage for the field of immersive analytics, would appear a significant opportunity.
Mimetics, affordance and virtual environments
When compared with the application of affordance theory to human behaviour in physical space, there is minimal exploration within research on human perception within virtual reality. Most research has an emphasis on the theory of presence, in terms of engendering physical interaction with virtual objects, as for example whether a surface looks slippery [38] or stepping off a virtual ledge [39]. Alongside the large amount of research into presence, our review revealed one source that utilized affordance theory to highlight a particular issue potentially relevant for immersive analytics, that of mimetics. Stuckey et al. [40] examine mimetic virtual worlds such as Second Life, from the lenses of affordance. Their reference is to Gibson’s original and broad understanding of affordance on the latency presented by an artefact, tool or environment for action. Using this broad definition, they present a distinction between what they term constructed and native affordances. This duality provides a contrasting approach to the cognitive, physical, sensory and functional distinctions of Hartson—albeit that their application case is mimetic virtual worlds, rather than considering the comparatively broad and abstract domain of HCI. The model simply looks at the latent possibility of a mimetic world in terms of the native affordance of the environment, such as an urban scene or a natural landscape. ‘Constructed’ or non-mimetic affordances are based on the native affordance, but are outside the constraints of what is normally possible in reality. For example while the user can ‘walk’ around the scene (natural affordance), there might be the capacity to ‘teleport’ to another position (constructed affordance).
Affordance theory was developed in response to the physical world and how we interact within physical constraints and in response to the properties of artefacts. The theory was extended through the development of affordance for HCI in the context of a hybrid world of physical apparatus (screen, mouse, keyboard, etc.) and graphic user interfaces. Hartson’s application of affordance assumed the user is present in the physical world and interacts with information displayed on a screen, interacting on the display. However in an immersive environment, while we are still standing or sitting in physical space, our visual, aural and kinaesthetic senses are primarily stimulated by synthetic content. We are within the data representations, as opposed to evaluating representations displayed on a monitor. Stuckey et al. argue that for virtual worlds, there are advantages in immersing the user in a mimetic environment that is organized and structured in the same manner as the real world, such as urban or natural scenes. According to this approach these ‘natural’ environments can then be systematically augmented with constructed features that complement the underlying mimetic structure.
Cross modal mapping
In this section we discuss the affordance of virtual reality in comparison to non-immersive computer displays. We consider direct perceptual properties such as spatial perception, shape recognition, colour differentiation, movement detection, haptics and aural positioning, but also highlight emergent relational properties such as perceived complexity, regularity, perceptual grouping and segmentation. Direct perceptual properties based on gestalt theory typically underpin visual analytics and are reasonably well understood. However, while these perceptual organisational principles have been extensively considered in the two-dimensional visual context, the shift to immersive environments augment vision with convincing spatialized sound, engages the kinaesthetic senses, and privileges egocentric spatial coding over allocentric visual reasoning. In short, the user is immersed in an environment of data, rather than observing graphic patterns on a visual display. Does this require a re-evaluation of gestalt principles, as typically used in relation to screen based data visualization? What does affordance theory add to gestalt methods, in the context of the affordance of virtual reality?
At the very least, the perceptual organisation, grouping and figure-ground principles will have to be considered across multiple sensory domains [41]. Synthesizing information across senses is one of the most fundamental, yet challenging aspects of our experience of the natural world. Even when it comes to the basic perceptual research, most effort is focused on perceptual processing in only one sensory modality at a time, despite the fact that nearly all events and objects in the natural environment stimulate multiple modalities simultaneously: for example, an approaching person simultaneously emits visual, auditory olfactory and even tactile stimulation. This stimulation is not only highly synchronised in space and time but it is also highly correlated such that the mapping between different sensory dimensions is not arbitrary [42]. For example objects that differ in size also tend to systematically differ in the type of a sound that they emit: e.g. mice and birds squeak while elephants and lions generate low pitched vocalisations; children have higher pitched voices than adults, females typically have higher pitch voices than males.
Moreover, these cross-modal mappings are neurally encoded and also evident early in the development. For example, both toddlers and adults map higher pitch to smaller bouncing balls compared to bigger balls [40]. There is also consistent perceptual mapping between high pitch and colours; colours and position in the visual field, and many others. These consistent, and seemingly ‘natural’ cross-modal mapping patterns have been referred to as cross-modal correspondences, defined as compatibility effects between different sensory attributes, or dimensions, of stimuli. In general, cross-modal correspondences are often found between polarized stimulus dimensions, such that a more-or-less extreme stimulus on a given dimension in one modality is compatible with a more-or-less extreme value on the corresponding dimension in another modality. As indicated earlier, increasing auditory pitch can be associated with smaller objects, higher spatial elevation and lighter visual stimuli [43]. Interestingly, the presentation of cross-modally corresponding pairs of stimuli is often perceived and described as ‘feeling just right’, despite the fact that there should not be any a priori correspondence between the paired dimensions/values.
While we still have somewhat limited understanding of how sensory inputs from different modalities are combined, merged, and/or integrated, one of the most valuable benefits that are afforded by a multisensory input is an increased redundancy of information that in turns facilitates information encoding and subsequent processing [44]. These processing benefits associated with a multisensory input are uniquely matched to the possibilities of immersive environments and would otherwise be hard to achieve. It is probably not an overestimation to say that the success of attempts at immersive analytics using immersive VR will be directly proportional to the degree of consistent mapping across stimulus dimensions and modalities, resulting in a stimulation that both is perceptually salient and one with a high degree of informational redundancy.
Another important aspect that will determine the success of immersive multisensory stimulations is the issue of how the informational content is distributed across space and over time. These spatio-temporal distributional characteristics are important in determining the spatial grain and the temporal sampling rate of information acquisition afforded by a particular spatio-temporal context [45]. It goes without saying that these parameters should be matched to the spatio-temporal sensitivities of the sensory systems that seem to be nearly universally optimally sensitive to a range or, usually intermediate levels, of intensity/contrast variations across space and time.
However, most, if not all, perceptual input is hierarchically organised, consisting of both local and global levels of information. Well-documented effects such as global precedence or global interference refer to the dominance of the global over local level of processing, the mechanisms of which remain a topic of long-standing interest in vision research [46, 47]. Although seemingly random, the distribution of local and global information in natural scenes is highly regular such that there is a large degree of self-similarity of perceivable spatial structure at different spatial scales.
While immersive environments are richer and more complex than non-immersive ones, this does not need to be associated with correspondingly higher degree of processing and comprehension difficulty. Although this might sound somewhat counterintuitive, Gibson has proposed that natural environments are easier to process compared to the simplified, artificial ones, precisely because the natural environments are more complex. The complexity here refers to the availability of information, and more available the information, as it unfolds during a perceiver’s active exploration of an environment, the easier it is to interact with the environment. Complex environments equal rich sets of affordances.
Conclusion
The interdisciplinary context and the lineage of activity that underpins the new field of immersive analytics, has led to a wide ranging inquiry. In this concluding section we reflect on the salient aspects of the preceding discussions, to outline principles for multi-dimensional, multi-sensory representations of big data, enabled by the affordance of immersive VR. In a targeted literature review we identified the scope of our project: our focus is on immersive virtual reality; the potential of the technology to engage visual, aural, haptic and kinaesthetic senses; with our research being located as part of the field of immersive analytics. Our position is aligned with Chandler et al. who suggest that immersion prompts a reconsideration of existing approaches within the field of visual analytics. To that end, we clarified that the ontology of immersion is significantly different to visual analytics, which operates in an allocentric mode where object-to-object relationships are studied on a computer monitor. An immersive display shifts human perception to an egocentric mode where spatialized data can be experienced across a range of senses. As a way to frame these differences, Fig. 3 compares the affordance of immersive VR with visual data mining undertaken on a computer monitor.

Comparative affordance of data representation on a monitor and with virtual reality
The body of knowledge that we propose is highly relevant for leveraging the potential of immersive technology for data representation, is Gibson’s ecological framework of human perception. His affordance theory has been influential within HCI through the research of Hartson et al. who developed four categories: cognitive, physical, sensory and functional affordance. In our discussion we suggested that the category of sensory affordance, relegated to a supportive role in the HCI framework, comes to the fore in an immersive interface. Research into how a range of senses can be exploited to advantage for the field of immersive analytics, would appear a significant opportunity. We then directed our attention to towards the use of affordance theory for virtual reality. In particular the research of Stuckey et al. who use affordance to underpin an approach based on mimetics, where a distinction is made between native (corresponding to real world experience) and constructed affordances.
In our discussion of affordance theory we developed the proposition that virtual environments dense with information are, if there is alignment with human ecological perception, easier to process than reductive graphic encoding. Key to the alignment with human perception is the spatial grain and the temporal sampling rate of information acquisition. The distribution of local and global information in natural scenes to which human perception is attuned, are a potential rich source of reference material for planning the distribution of data within an immersive environment. Immersive technology also opens up a wider sensory field that with current technology, allows the complimenting of spatialized visualization with aural, kinetic and tactile modes. Cross-modal mapping such as equating aural pitch to geometric scale are neurally encoded within human beings, with the benefit that multisensory input improves information encoding and subsequent cognitive processing. We also propose that the degree of consistent mapping across stimulus dimensions and modalities are a key factor that needs to be considered. Simply put, exploratory data analysis undertaken in an immersive environment potentially allows a wider range of human senses to be engaged. But for this potential to be realized, data representations should align with the characteristics of environments to which human ecological perception is attuned.
Principles for developing immersive analytics application
The objective of this article has been to identify principles that can underpin the development of VR environments for Immersive Analytics. We propose that the processing benefits associated with multisensory inputs that are aligned with the capacity of human perception, are uniquely matched to the affordance of immersive environments. At the present stage of technical development, software platforms and hardware allow experimentation with a fine grained mapping of data to visual, aural and kinaesthetic senses, with growing capacity for engagement of the haptic senses. While olfactory and gustatory senses are important in order to leverage the full range of cross modal inputs to facilitate information encoding and subsequent cognitive processing—visual, aural, kinaesthetic and tactile sensory stimulation provide a rich set of possibilities to undertake research and development. In summary we propose that the specification and design of prototype immersive analytics applications and interfaces can productively consider the following principles. These are outlined here to provide a starting point for further research and experimentation with prototype applications.
-
Principle 1.
Build from a mimetic approach to data mapping that aligns spatial, aural, tactile and kinaesthetic attributes with abstractions of environments to which human perception has become attuned. As indicated in Fig. 4 these can range from natural environments such as terrain, ocean, sky and galaxy analogies to man-made environments such as cities, buildings and rooms.
Fig. 4 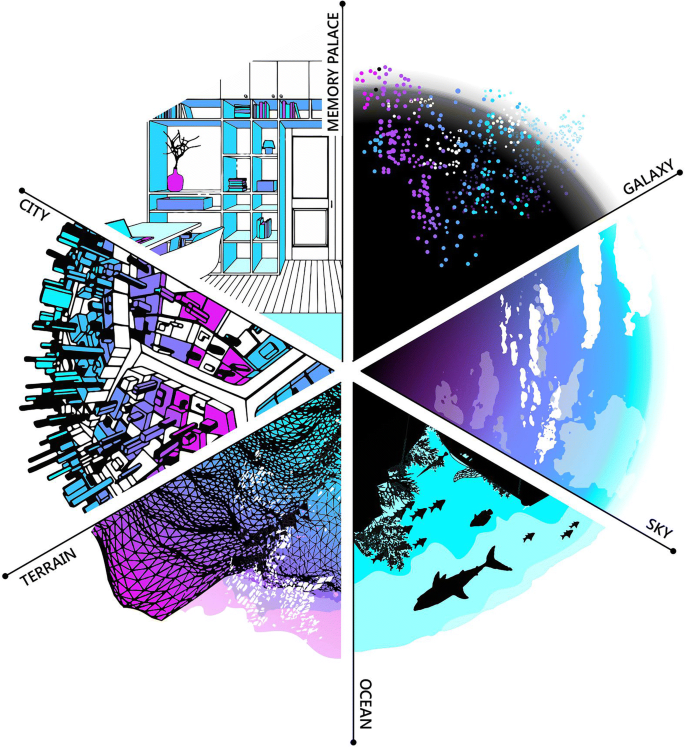
Immersive Analytics Principle 1: use abstractions of environments to which human perception is attuned
-
Principle 2.
As illustrated in Fig. 5, mimetic encoding of data can be productively combined with constructed affordances, which can extend those found in natural environments. This approach builds on the research of Stucky et al. [21], where the 3D real world metaphor is integrated with layers of geometric objects and interface affordances such as multiple camera and teleporting.
Fig. 5 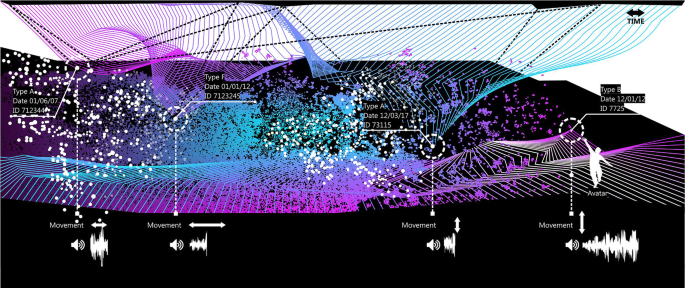
Immersive Analytics Principle 2: natural affordance of mimetic reference overlaid with constructed affordances
-
Principle 3.
Cross-modal mapping can be exploited to facilitate information encoding that is perceptually salient. For example, as illustrated in Fig. 6, motion can be associated with sound to reinforce perception of consistent data patterns or conversely, draw attention to anomalies.
Fig. 6 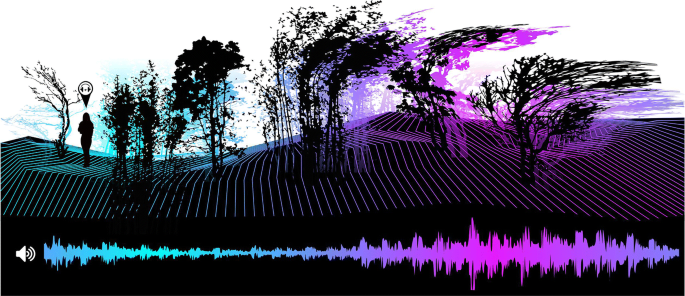
Immersive Analytics Principle 3: utilize cross-modal mapping e.g. sound aligned with movement
-
Principle 4.
Rather than extreme contrasts, data mapping to representations is best deployed at the intermediate levels of intensity/contrast variations across space and time. As illustrated in Fig. 7, human ecological perception is most attuned to this intermediate zone, where very subtle differences in information can be identified.
Fig. 7 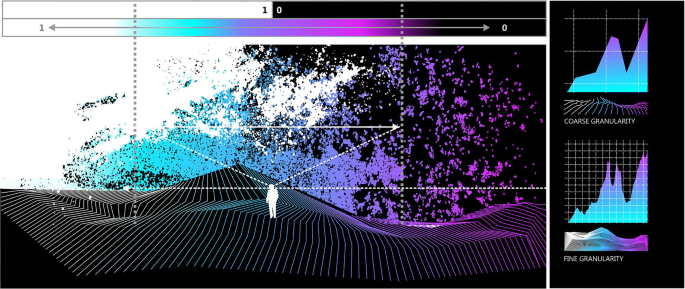
Immersive Analytics Principle 4: representations tuned to intermediate zone where human perception is most discerning
-
Principle 5.
As illustrated in Fig. 8, naturally occurring distribution patterns of local and global sensory textures can form the basis for the granularity and distribution of data within immersive virtual environments. Layers of data should be hierarchically organized, consisting of both local and global levels of information.
Fig. 8 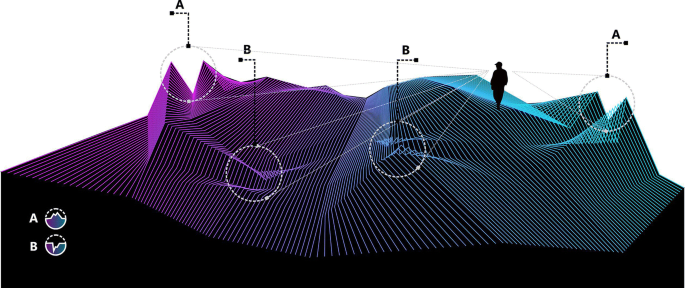
Immersive Analytics Principle 5: granularity and distribution of data aligned with naturally occurring distribution patterns


Abbreviations
- CAVE:
-
computer aided virtual environment
- EDA:
-
exploratory data analysis
- HCI:
-
human computer interfaces
- HMD:
-
head mounted display
- VR:
-
virtual reality
- VDM:
-
visual data mining
References
Keim DA. Information visualization and visual data mining. IEEE Trans Vis Comput Graph. 2002;8:1–8.
De Oliveira F, Ferreira MC, Levkowitz H. From visual data exploration to visual data mining: a survey. IEEE Trans Vis Comput Graph. 2003;9:378–94.
Kreylos O, Bethel EW, Ligocki TJ, Hamann B. Virtual-Reality Based Interactive Exploration of Multiresolution Data. In: Hamann B, Hagen H, Farin G, editors. Hierarchical Geom. methods Sci. Vis. Berlin: Springer; 2003. p. 205–24.
Azzag H, Venturini G. VRMiner: a tool for multimedia database mining with virtual reality VRMiner: a tool for multimedia database mining with virtual reality 319. In: Process. Manag. Complex Data Decis. Support (EA 2101). 2005. P. 318–39.
Bayyari A, Tudoreanu ME. The impact of immersive virtual reality displays on the understanding of data visualization. Proc ACM Symp Virtual Real Softw Technol. 2006;3:368. https://doi.org/10.1145/1180495.1180570.
Chandler T, Cordeil M, Czauderna T, et al. Immersive analytics. In: Big Data Vis. Anal. 2015. p. 1–8.
Hartson R. Cognitive, physical, sensory, and functional affordances in interaction design. Behav Inf Technol. 2003;22:315–38. https://doi.org/10.1080/01449290310001592587.
Gibson JJ. The ecological approach to visual perception. Classic ed. New York: Psychology Press; 2014.
Reed ES, Jones RK. James Gibson’s ecological revolution in psychology. Philos Soc Sci. 1979;9:189–204. https://doi.org/10.1177/004839317900900206.
Stucky SU, Shaw B, Ark W. Virtual environments overview. San Jose CA: IBM Almaden Research Centre; 2009.
Blazhenkova O, Kozhevnikov M. Visual-object ability: a new dimension of non-verbal intelligence. Cognition. 2010;117:276–301. https://doi.org/10.1016/j.cognition.2010.08.021.
Andrienko N, Andrienko G, Gatalsky P. Exploratory spatio-temporal visualization: an analytical review. J Vis Lang Comput. 2003;14:503–41. https://doi.org/10.1016/S1045-926X(03)00046-6.
Ammoura A. DIVE-ON. Crossroads. 2001;7:4. https://doi.org/10.1145/367884.367891.
Wegman EJ, Symanzik J. Immersive projection technology for visual data mining. J Comput Graph Stat. 2002;11:163–88. https://doi.org/10.1198/106186002317375668.
Cruz-Neira C, Sandin DJ, DeFanti TA, et al. The CAVE: audio visual experience automatic virtual environment. Commun ACM. 1992;35:64–72. https://doi.org/10.1145/129888.129892.
Symanzik J, Symanzik J, Cook D, et al. Dynamic Statistical Graphics in the C2 Virtual Reality Environment. Virtual Real 1993; 1–11.
Ammoura A, Perron M, Zaïane O (2000) Walking the Data Cube: An Immersed Virtual Environment for Visualising Data Mining Results. In: Proc. Ski. West. Comput. Graph. Symp. p. 213–8.
Azzag H, Picarougne F, Guinot C, Venturini G (1AD) VRMiner. In: Process. Manag. Complex Data Decis. Support. IGI Global, p. 318–39.
Wijayasekara D, Linda O, Manic M. CAVE-SOM: Immersive visual data mining using 3D Self-Organizing Maps. In: 2011 Int. Jt. Conf. Neural Networks. IEEE, 2011. p. 2471–8.
Nagel HR, Granum E, Musaeus P. Methods for Visual Mining of Data in Virtual Reality. Proc. Int. Work. Vis. Data Min. 2001.
Nagel HR, Vittrup M, Granum E, Bovbjerg S. Exploring nonlinear data relationships in vr using the 3d visual data mining system. In: Proc. Int. Work. Vis. Data Mining, conjunction with Third IEEE Int. Conf. Data Min. 2003.
Nagel HR, Granum E, Bovbjerg S, Vittrup M. Immersive visual data mining: the 3DVDM approach. In: Simoff SJ, et al., editors. Vis. Data Min. Berlin: Springer; 2008. p. 281–311.
Donalek C, Djorgovski SG, Cioc A, et al. Immersive and Collaborative Data Visualization Using Virtual Reality Platforms. In: IEEE Int. Conf. Big Data. 2014. p. 609–14.
Teras M, Raghunathan S. Big data visualisation in immersive virtual reality environments: embodied phenomenological perspectives to interaction. Int J Soft Comput. 2015;5:1009–15. https://doi.org/10.21917/ijsc.2015.0141.
Moran A, Gadepally V, Hubbell M, Kepner J. Improving big data visual analytics with interactive virtual reality. In: High Perform. Extrem. Comput. Conf. IEEE, 2015. p. 1–6.
Olshannikova E, Ometov A, Koucheryavy Y, Olsson T. Visualizing big data with augmented and virtual reality: challenges and research agenda. J Big Data. 2015;2:1–27. https://doi.org/10.1186/s40537-015-0031-2.
Garcia-Hernandez RJ, Anthes C, Wiedemann M, Kranzlmuller D. Perspectives for using virtual reality to extend visual data mining in information visualization. In: 2016 IEEE Aerosp. Conf. IEEE, 2016. p. 1–11.
Immersive analytics network. http://immersiveanalytics.net. Accessed 1 June 2017.
Dourish P. What we talk about when we talk about context. Pers Ubiquitous Comput. 2004;8:19–30.
Shneiderman B. The eyes have it: a task by data type taxonomy for information visualizations. In: IEEE Symp. Vis. Lang. 1996. P. 336–43.
Sadana R, Setlur V, Stasko J. Redefining a contribution for immersive visualization research. In: Proc 2016 ACM companion interact surfaces spaces—ISS companion’16. 2016. p. 41–5. https://doi.org/10.1145/3009939.3009946.
Milgram P, Kishino F. A taxonomy of mixed reality visual displays. IEICE Trans. Inf. Syst. E77–D. 1994.
Sacha D, Stoffel A, Stoffel F, et al. Knowledge generation model for visual analytics. Vis Comput Graph IEEE Trans. 2014. https://doi.org/10.1109/tvcg.2014.2346481.
Lindeman RW, Noma H. A classification scheme for multi-sensory augmented reality. In: Proc 2007 ACM Symp Virtual Real Softw Technol. 2007. https://doi.org/10.1145/1315184.1315216.
Normand J-M, Servières M, Moreau G. A new typology of augmented reality applications. In: Proc 3rd Augment Hum Int Conf. 2012. https://doi.org/10.1145/2160125.2160143.
Norman DA. Affordance, conventions, and design. Interactions. 1999;6:38–43. https://doi.org/10.1145/301153.301168.
Flach JM, Holden JG. The reality of experience: Gibson’s Way. Presence Teleoperators Virtual Environ. 1998;7:90–5. https://doi.org/10.1162/105474698565550.
Gaver WW. Technology affordances. In: Proc. SIGCHI Conf. Hum. factors Comput. Syst. Reach. through Technol. New York: ACM Press; 1991. p. 79–84.
Lin Q, Rieser J, Bodenheimer B. Affordance judgments in HMD-based virtual environments. ACM Trans Appl Percept. 2015;12:1–21. https://doi.org/10.1145/2720020.
Stucky SU, Shaw B, Ark W. Virtual environments overview. San Jose: IBM Almaden Research Center; 2009.
Grassi M. Do we hear size or sound? Balls dropped on plates. Percept Psychophys. 2005;67:274–84. https://doi.org/10.3758/BF03206491.
De Gelder B, Bertelson P. Multisensory integration, perception and ecological validity. Trends Cogn Sci. 2003;7:460–7. https://doi.org/10.1016/j.tics.2003.08.014.
Spence C, Deroy O. Crossmodal correspondences: innate or learned? Iperception. 2012;3:316–8. https://doi.org/10.1068/i0526ic.
Senkowski D, Schneider TR, Foxe JJ, Engel AK. Crossmodal binding through neural coherence: implications for multisensory processing. Trends Neurosci. 2008;31:401–9. https://doi.org/10.1016/j.tins.2008.05.002.
Hommel B, Zmigrod S. Feature integration across multimodal perception and action: a review. Multisens Res. 2013;26:143–57. https://doi.org/10.1163/22134808-00002390.
Navon D. Forest before trees: the precedence of global features in visual perception. Cogn Psychol. 1977;9:353–83. https://doi.org/10.1016/0010-0285(77)90012-3.
Ridderinkhof KR, van der Molen MW. When global information and local information collide: a brain potential analysis of the locus of interference effects. Biol Psychol. 1995;41:29–53. https://doi.org/10.1016/0301-0511(95)05125-T.
Authors’ contributions
All authors read and approved the final manuscript.
Acknowledgements
Not applicable.
Competing interests
The authors declare that they have no competing interests.
Availability of data and materials
Not applicable.
Consent for publication
All four authors have given consent to publish.
Ethics approval and consent to participate
Not applicable.
Funding
Not applicable.
Publisher’s Note
Springer Nature remains neutral with regard to jurisdictional claims in published maps and institutional affiliations.
Author information
Authors and Affiliations
Corresponding author
Rights and permissions
Open Access This article is distributed under the terms of the Creative Commons Attribution 4.0 International License (http://creativecommons.org/licenses/by/4.0/), which permits unrestricted use, distribution, and reproduction in any medium, provided you give appropriate credit to the original author(s) and the source, provide a link to the Creative Commons license, and indicate if changes were made.
About this article

Cite this article
Moloney, J., Spehar, B., Globa, A. et al. The affordance of virtual reality to enable the sensory representation of multi-dimensional data for immersive analytics: from experience to insight. J Big Data 5, 53 (2018). https://doi.org/10.1186/s40537-018-0158-z
Received:
Accepted:
Published:
DOI: https://doi.org/10.1186/s40537-018-0158-z